Most car rental operators assume their spreadsheets are "good enough." They track vehicles, log returns, and note maintenance dates. But that assumption quietly costs money every single month. Predictive maintenance alone can cut fleet costs by 18% and reduce downtime by 22%, while dynamic pricing and utilization tracking measurably boost both revenue and customer satisfaction. This guide walks you through what modern fleet reporting actually looks like, which metrics move the needle, how to solve real operational problems with data, and which tools deliver the best return for small to medium rental businesses.
Table of Contents
- Why fleet reporting matters for car rental businesses
- Core methodologies: How modern fleet reporting works
- Key metrics: What you should track (and why)
- Solving real-world challenges with effective fleet reporting
- Best practices and setting up for long-term success
- Explore fleet management solutions tailored for your business
- Frequently asked questions
Key Takeaways
| Point | Details |
|---|---|
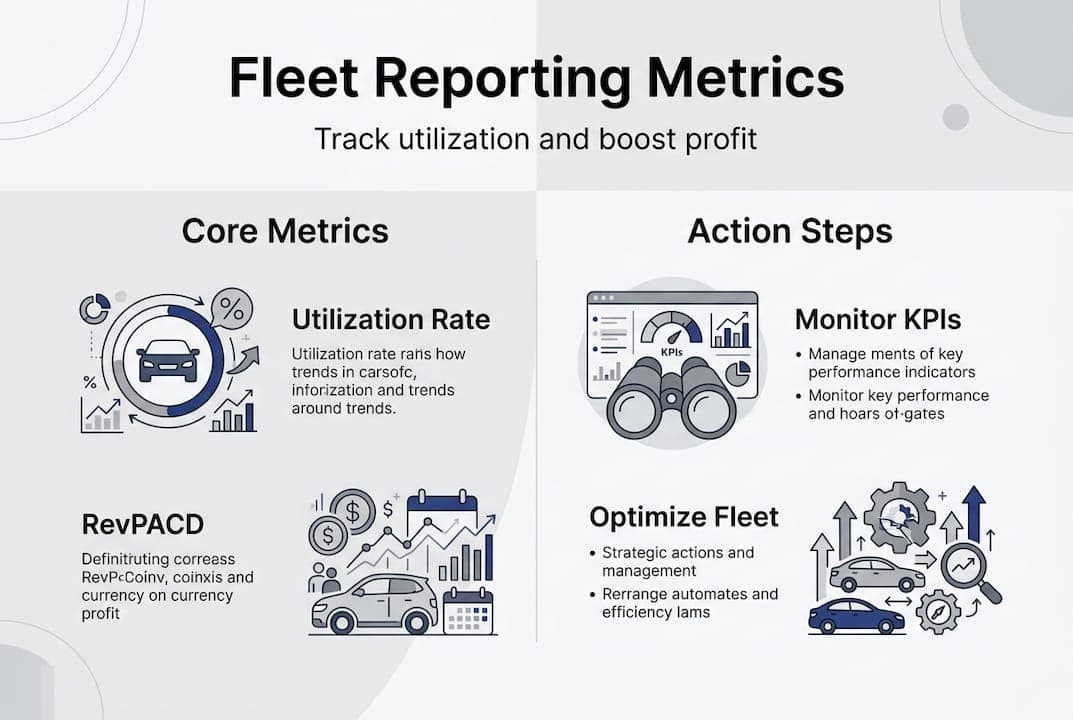
| Focus on utilization rate | Keeping fleet utilization above 70% directly improves profitability and efficiency. |
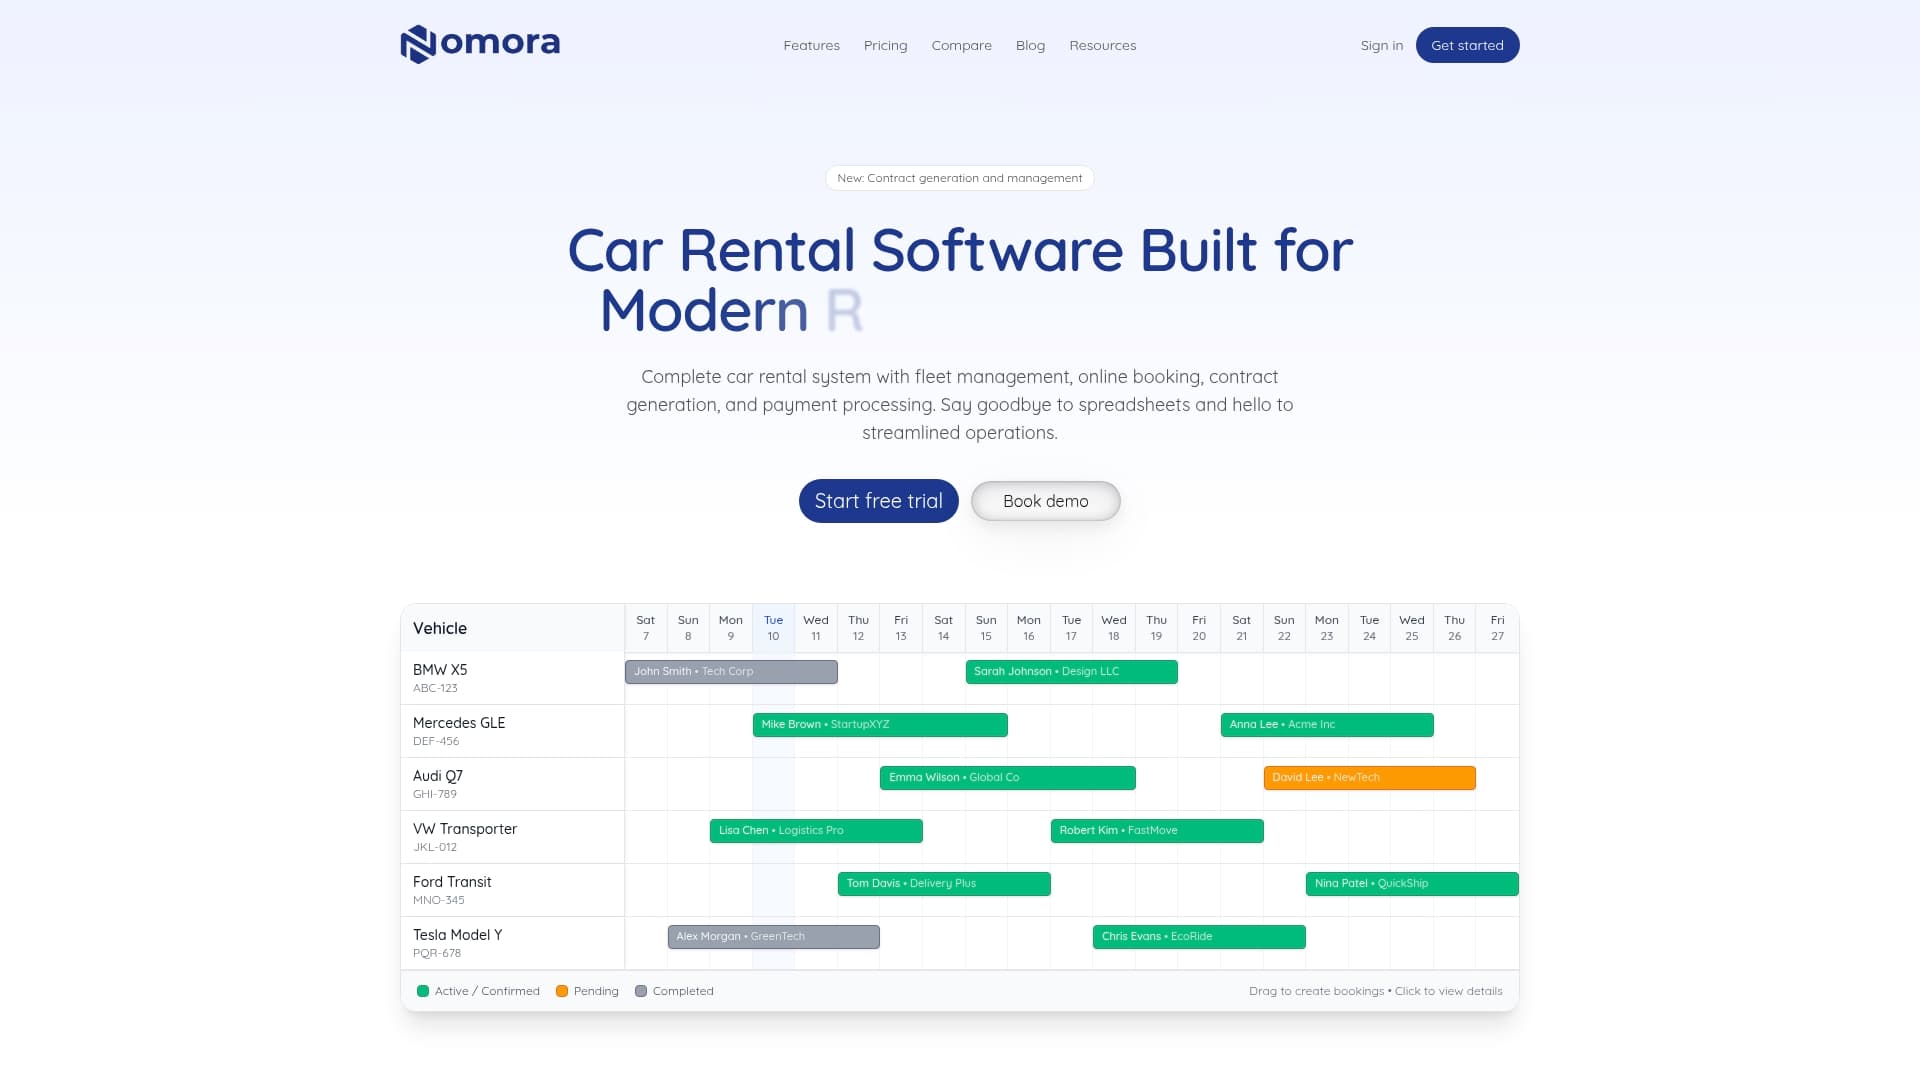
| Embrace modern reporting | Real-time, integrated tools outperform spreadsheets with better insight and cost savings. |
| Track actionable KPIs | Monitor utilization, RevPACD, maintenance cost percentage, and cost per mile to drive results. |
| Solve operational pain points | Effective fleet reporting prevents double bookings, billing errors, and maintenance gaps. |
Why fleet reporting matters for car rental businesses
Fleet reporting is the continuous process of tracking, measuring, and optimizing every asset and activity in your rental operation. Think of it as the central nervous system of your business. Without it, decisions get made on gut feel rather than facts, and that gap between instinct and reality is where profit disappears.
Poor reporting creates a chain reaction of problems. Vehicles sit idle when they could be generating revenue. Maintenance gets delayed until a breakdown forces your hand. Billing errors slip through unnoticed. Customers experience friction that damages your reputation. Every one of these issues has a measurable cost.
Utilization rates below 70% are a clear signal of profit loss. Yet 40% of operators still rely on spreadsheets instead of centralized, real-time fleet data, leaving significant efficiencies on the table. The operators who close that gap gain a real competitive edge.
Data-driven fleet reporting delivers tangible business impact across every function:
- Reduced idle time through real-time vehicle availability tracking
- Lower maintenance costs by catching issues before they escalate
- Higher revenue from optimized pricing and utilization
- Fewer billing disputes with automated, accurate invoicing
- Better customer satisfaction through reliable vehicle availability and faster service
- Smarter purchasing decisions based on actual demand patterns
"Operators who move from spreadsheets to integrated fleet reporting platforms consistently report faster decision-making, fewer operational surprises, and stronger margins."
For a deeper look at how fleet data connects to overall operations, the fleet management guide covers the full operational picture. You can also explore the specific real-time tracking benefits that modern platforms deliver.
Core methodologies: How modern fleet reporting works
Knowing why reporting matters is one thing. Understanding how it actually works in practice is where most operators get stuck. The gap between legacy methods and modern platforms is wider than many realize.
| Feature | Legacy (spreadsheets/manual) | Modern (cloud/telematics/AI) |
|---|---|---|
| Data entry | Manual, error-prone | Automated, real-time |
| Reporting speed | Hours or days | Instant dashboards |
| Anomaly detection | Reactive (after the fact) | Proactive alerts |
| Maintenance scheduling | Calendar-based guesswork | Predictive, mileage-triggered |
| Multi-location visibility | Fragmented, siloed | Unified, centralized |
| Integration | None or limited | GPS, payments, reservations |
| Cost for SMBs | Low upfront, high hidden cost | Scalable SaaS pricing |
Modern platforms combine real-time telematics, AI-powered anomaly detection, predictive maintenance, utilization tracking by vehicle or branch, and KPI dashboards into a single interface. That integration is what separates operators who react to problems from those who prevent them.
Real-time dashboards give you a live view of every vehicle: where it is, its current status, upcoming maintenance needs, and revenue performance. Anomaly alerts flag unusual patterns automatically, like a vehicle logging unexpected mileage or a reservation gap that signals a missed booking opportunity. Predictive analytics take historical data and surface actionable forecasts before problems develop.

Cloud-based integrated platforms that combine telematics, maintenance, and reservations yield the highest ROI for small to medium rental businesses. The reason is simple: when all your data lives in one place, you stop wasting time reconciling systems and start making faster, better decisions.
For more on how analytics translate into operational gains, the rental data analytics guide is worth reviewing. You can also see how real-time tracking transforms day-to-day operations in practice.
Pro Tip: Data silos are the silent killer of fleet efficiency. If your reservation system, maintenance logs, and GPS data live in separate tools that don't talk to each other, you're making decisions with incomplete information. Prioritize platforms that integrate all three.
Key metrics: What you should track (and why)
Once your reporting methodology is in place, the next step is knowing which numbers actually matter. Not every metric deserves equal attention. Focus on the ones with direct revenue and cost implications.
Key KPIs for profitable rental operations include:
- Utilization rate: The percentage of available vehicles actively rented. Target: 70 to 85%.
- RevPACD (Revenue Per Available Car Day): Total revenue divided by total available car days. Tracks revenue efficiency across your fleet.
- ADR (Average Daily Rate): Average revenue earned per vehicle per rental day. Reflects pricing effectiveness.
- Maintenance cost %: Maintenance spend as a percentage of total revenue. Target: 5 to 15%.
- Cost per mile: Total operating cost divided by miles driven. Industry range: $0.23 to $0.51.
| KPI | Target / industry average | Action if outside range |
|---|---|---|
| Utilization rate | 70 to 85% | Below 70%: review pricing, adjust inventory mix |
| RevPACD | Varies by market | Declining: audit pricing strategy and demand patterns |
| ADR | Market-dependent | Low: test dynamic pricing; high: monitor booking volume |
| Maintenance cost % | 5 to 15% of revenue | Above 15%: audit maintenance schedule and vendor costs |
| Cost per mile | $0.23 to $0.51 | Above $0.51: review fuel, tire, and repair spend |
Utilization rate is the single most watched number in fleet management. Most profitable operators land between 70 and 79%, with top performers pushing above 80%. Falling below 70% consistently means you either have too many vehicles for your demand, or your pricing and availability management needs work.
Tracking RevPACD alongside ADR gives you a more complete picture than either metric alone. A high ADR with low RevPACD often signals availability gaps or booking friction. Fixing those gaps directly increases revenue without adding a single vehicle to your fleet.
For a practical breakdown of how utilization connects to profitability, the fleet utilization management guide provides actionable detail. The rental software features overview also covers how the right tools surface these metrics automatically.