TL;DR:
- Fleet utilization measures the productive use of the available fleet capacity, not profitability directly. Confusing different calculation methods and data inaccuracies can mislead operational decisions and fleet sizing strategies.
Most fleet managers assume that high utilization numbers signal a healthy, profitable operation. That assumption is worth questioning. What is fleet utilization, really? At its core, fleet utilization is an efficiency metric measuring how much of your available fleet capacity is being put to productive use. But the term covers several distinct calculation methods, and confusing them with related concepts like fleet availability can send your operational decisions in the wrong direction. This article clarifies the definitions, walks through the math, and gives you a practical framework for turning utilization data into real cost savings and smarter fleet decisions.
Key takeaways
| Point | Details |
|---|
| Utilization is an efficiency metric | It measures productive use against available capacity, not revenue or profitability directly. |
| Three calculation approaches exist | Time-based, distance-based, and load-based methods each reveal different operational realities. |
| Availability and utilization are different | Confusing the two leads to misdiagnosed problems and the wrong operational fixes. |
| Targets typically fall around 75-80% | Chasing 100% utilization removes the operational buffer that protects against disruptions. |
| Data quality determines metric quality | Inaccurate downtime records and idle time classification will skew every calculation you run. |
What fleet utilization actually means
Fleet utilization is the ratio of productive use to available capacity across your vehicle assets, expressed as a percentage. The standard formula is straightforward: (Total productive hours ÷ Total available hours) × 100. What makes it complicated is how you define "productive" and "available" in the context of your specific operation.
The industry applies three calculation methods depending on what behavior it wants to measure:
- Time-based utilization: Active operating hours divided by total available hours. This is the most common method and works well for service and rental fleets.
- Distance-based utilization: Loaded miles divided by total miles traveled. Especially relevant for freight and delivery operations where deadhead miles represent wasted capacity.
- Capacity/load-based utilization: Actual cargo load divided by rated vehicle capacity. Used heavily in logistics where a truck running at 40% payload is still underperforming even if it's on the road all day.
Alongside the calculation method, you need to understand the difference between two related but distinct metrics: fleet utilization and fleet availability. Fleet availability measures (Available hours ÷ Total scheduled hours) × 100, with the focus on downtime and maintenance periods. A vehicle can be highly available and still have low utilization if your scheduling is inefficient. Conversely, poor availability constrains how high utilization can realistically climb.
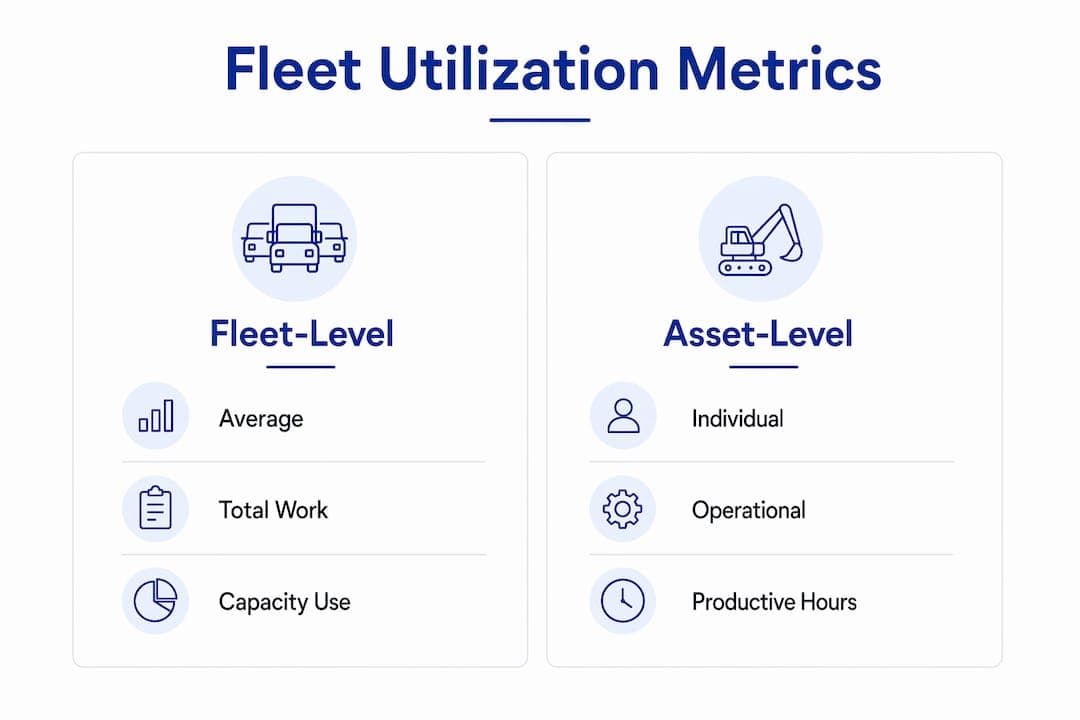
There's also an important distinction between fleet-level and asset-level tracking. Fleet-level utilization gives you an aggregate picture across all vehicles. It's the executive dashboard view. Asset-level utilization drills into individual vehicles, which is where operations teams identify specific underperformers, misallocated assets, or vehicles that need redeployment.
| Metric | What it measures | Primary use |
|---|
| Fleet utilization | Productive use vs. available capacity (whole fleet) | Strategic planning, fleet sizing |
| Asset utilization | Productive use of a single vehicle | Dispatch decisions, redeployment |
| Fleet availability | Scheduled hours minus downtime | Maintenance planning, reliability tracking |
Consistent definitions across your numerator and denominator are non-negotiable. If one manager counts shift hours as "available" and another counts only dispatched hours, your utilization figures become incomparable across locations or time periods.
Common pitfalls in measuring utilization accurately
Measuring fleet utilization sounds simple until you try to do it reliably at scale. The gap between what your telematics system reports and what's actually happening on the ground is often significant.

The most common error is treating engine-on time as productive time. A vehicle running its engine while waiting at a loading dock, sitting in traffic, or idling between assignments is not performing productive work. Accurate measurement requires a clear classification of working versus idle states, and most basic GPS or telematics setups don't make that distinction automatically. Your dashboard might show 10 hours of engine activity for a vehicle that performed 6 hours of actual work.
Downtime recording introduces another layer of error. Incorrect downtime timestamps can understate downtime by hours at a stretch, which artificially inflates your availability figures and then distorts your utilization calculations downstream. If a vehicle goes in for maintenance but the return-to-service timestamp is logged two hours early because a technician cleared it in the system before the vehicle was actually ready, every metric that follows is off.
Mixed fleets create their own challenges. Electric vehicles have fundamentally different usage patterns than diesel or gasoline vehicles. Charging windows, range constraints, and energy consumption profiles mean that harmonizing diverse fleet data across vehicle types requires deliberate metric standards. Without those standards, you end up comparing numbers that are not measuring the same thing.
Pro Tip: Before acting on any utilization metric, audit how your team defines productive time and how downtime is logged in your system. Fixing data quality issues upstream will give you more reliable insights than any reporting tool layered on top of bad inputs.
A few other measurement pitfalls worth watching:
- Mixing vehicle types with different operational expectations in a single utilization calculation
- Using fleet-level averages to make asset-level decisions, which masks underperforming individual vehicles
- Ignoring seasonal or demand-driven variation when setting baseline benchmarks
- Failing to account for planned downtime such as seasonal maintenance in your available hours denominator
How to use utilization data to reduce costs
Understanding your numbers is one thing. Knowing what to do with them is where the operational value lives. Here's a structured approach to turning fleet utilization metrics into cost-reducing decisions.
-
Identify your underperforming assets first. Pull asset-level utilization for every vehicle in your fleet. Anything running consistently below 50% utilization over a 90-day period deserves a hard look. The question isn't whether it's being used. The question is whether the operational benefit justifies its total cost of ownership.
-
Set realistic targets based on your operational model. Corporate fleet operations typically target 75-80% utilization, not 100%. That buffer exists for a reason. Peak demand periods, maintenance cycles, driver availability, and emergency coverage all require spare capacity. A fleet running at 95% utilization for months is fragile. One unexpected surge in demand or a cluster of maintenance events and the whole schedule breaks.
-
Use the data to right-size your fleet. Consistently high fleet-level utilization across a period of sustained demand growth is a strong signal that you need more vehicles. Consistently low utilization is a signal to retire, sell, or redeploy underused assets before they continue accumulating carrying costs. Explore the principles behind this in the vehicle fleet management guide for car rentals.
-
Evaluate rent-versus-own decisions with confidence. When certain vehicle categories show chronic underutilization, renting additional capacity during peak periods rather than carrying excess assets year-round often makes more financial sense. Utilization data gives you the evidence base for that conversation.
-
Feed utilization data into your maintenance scheduling. High-utilization vehicles accumulate wear faster. If your maintenance intervals are set by time rather than usage, you may be over-servicing low-use assets and under-servicing high-use ones simultaneously. Aligning maintenance triggers with actual usage data reduces both costs and unplanned downtime.
Pro Tip: Combine fleet-level and asset-level utilization views when making redeployment decisions. Fleet-level averages can look healthy even when individual assets are deeply underperforming. The aggregate number is a starting point, not a conclusion.
One of the most overlooked opportunities in fleet management best practices is using utilization data to improve scheduling. When you know which vehicles are consistently available during which windows, you can match asset assignments to demand patterns rather than defaulting to the same vehicles repeatedly.
Real-world insights: EV fleets and standardized metrics
The conversation around fleet utilization is evolving as electric vehicles become a larger share of commercial and corporate fleets. Traditional utilization frameworks don't map cleanly onto EV operations, and the industry is actively working to close that gap.
The U.S. Department of Energy's EVs@Scale Next-Gen Profiles study analyzed hourly cadence utilization data across 17 EV fleets. The goal was to create standardized metrics that enable consistent comparison and actionable energy management insights. What the study found reinforces a broader principle: harmonized data standards are what separate fleets that can benchmark themselves meaningfully from those operating blind.
EV fleets show distinctly different utilization patterns compared to conventional fleets. Charging requirements create mandatory downtime windows that must be factored into available hours calculations. If you treat a vehicle that's charging as "available," you overstate your capacity. If you treat it as "down," you understate availability. The right answer depends on whether charging is scheduled or unscheduled, and whether the vehicle could theoretically be in service if needed.
| Fleet type | Key utilization consideration | Metric adjustment needed |
|---|
| Conventional vehicle fleet | Idle vs. active engine time | Classify productive vs. non-productive hours |
| Electric vehicle fleet | Charging windows and range limits | Exclude scheduled charging from available hours |
| Mixed fleet | Inconsistent usage profiles | Apply harmonized standards across vehicle types |
Standardized, harmonized utilization metrics are not just a data management preference. They're the foundation for making defensible decisions about fleet size, energy infrastructure, and operational scheduling across diverse asset types.
For logistics managers running mixed fleets, the practical takeaway is to define explicit metric standards for each vehicle category before consolidating data into a single utilization report. Applying one framework to all vehicle types produces averages that obscure the real picture at the category level.
My honest take on fleet utilization metrics
I've seen fleet managers receive a utilization report, see a number above 80%, and walk away satisfied. That response makes me genuinely nervous. High utilization is not the same as good operations. It's one data point in a much larger picture.
What I've learned is that the danger isn't in tracking utilization. It's in treating it as a proxy for profitability or overall fleet health. A fleet running at 85% utilization with poor maintenance scheduling, high unplanned downtime, and no operational buffer is more exposed than one running at 70% with clean data and disciplined scheduling.
The lesson I keep coming back to is this: fix your data before you trust your metrics. I've worked through situations where utilization numbers looked strong until someone audited the downtime logging process and discovered hours of misclassified idle time. The number went down. The actual operational picture became clearer. And decisions that had been made on the original figures needed to be revisited.
My advice is to treat utilization as a starting point for questions, not as a final answer. When a vehicle's utilization drops, ask why before acting. Is it a scheduling problem? A maintenance bottleneck? A seasonal demand shift? The metric tells you something is worth investigating. It rarely tells you exactly what to do. Pair your utilization tracking with fleet reporting tools that surface the context behind the numbers, and you'll make far better operational calls.
— Dizzy
How Nomora supports smarter fleet utilization tracking
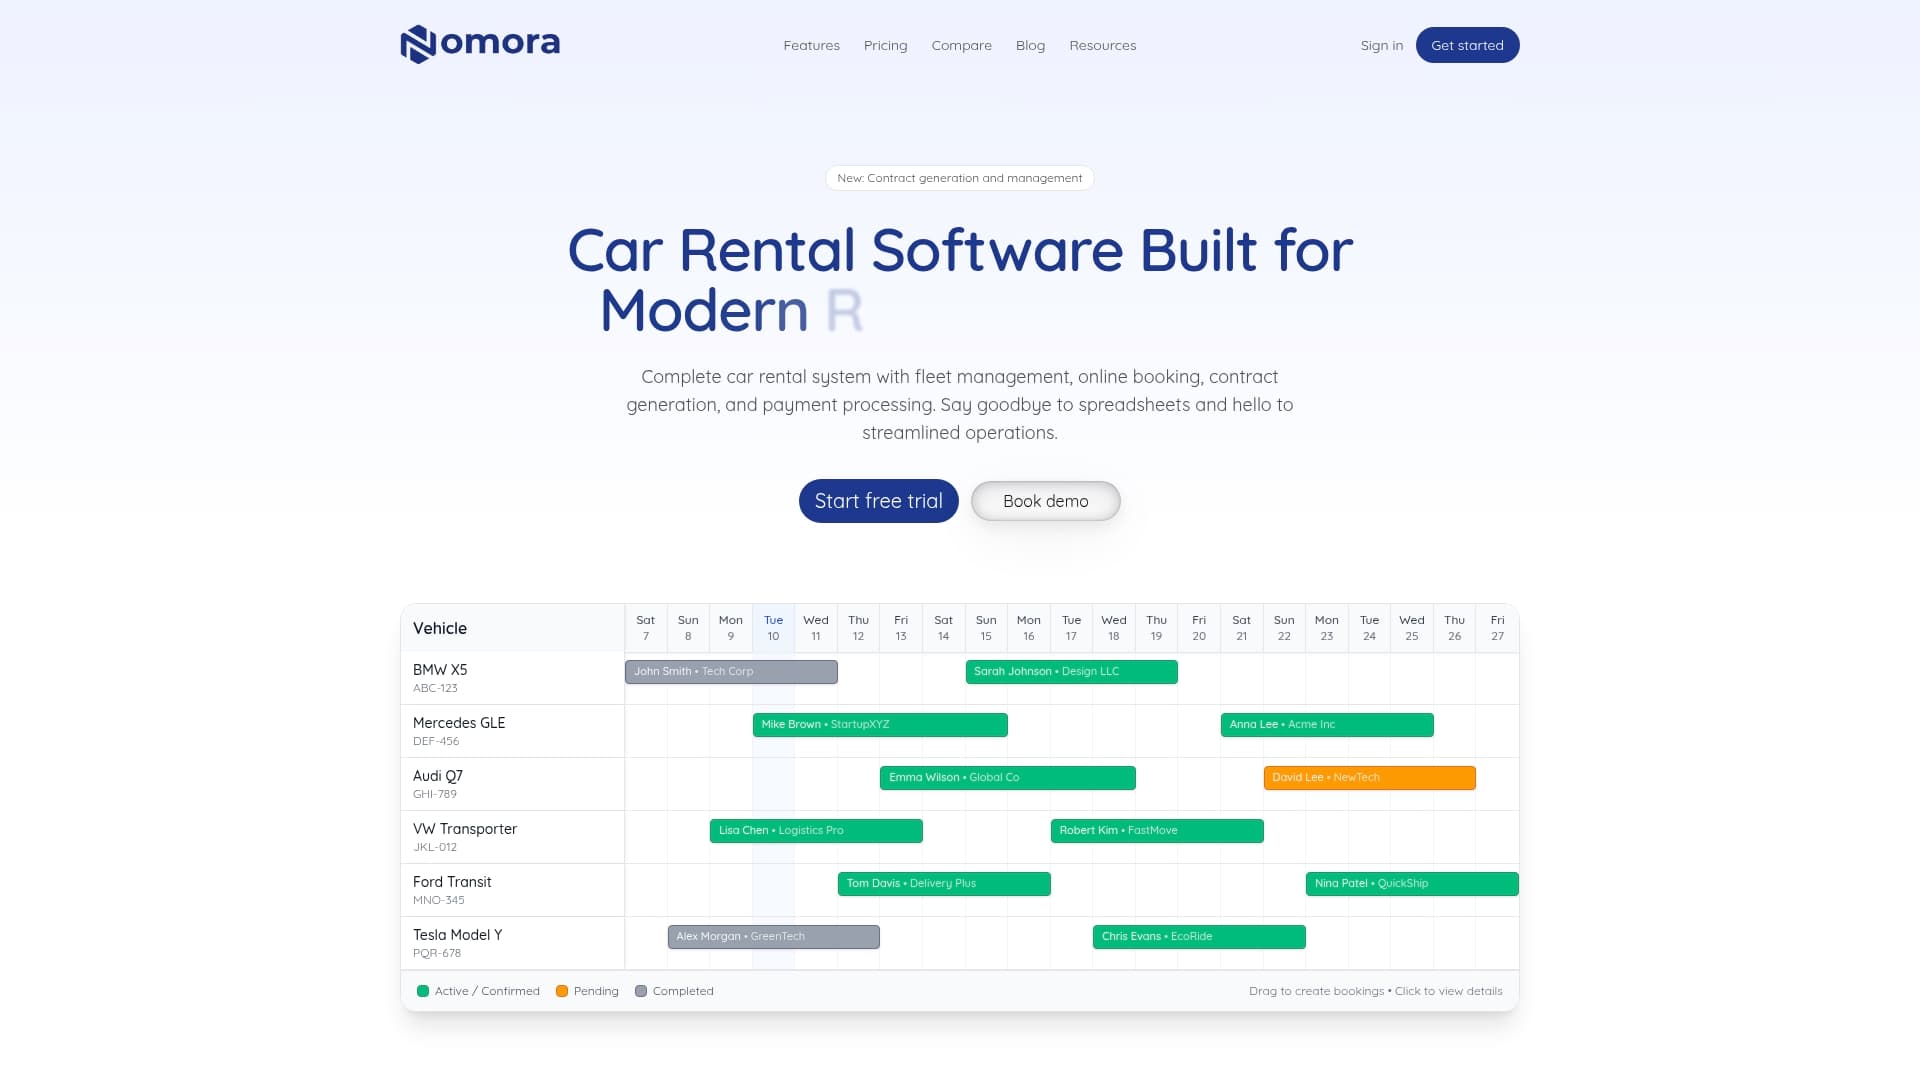
If you're managing a rental fleet and relying on spreadsheets or disconnected systems to track utilization, you're working with an incomplete picture. Nomora's cloud-based car rental management platform acts as the central nervous system of your operation, connecting reservations, fleet status, maintenance records, and reporting in one place. Real-time visibility into which vehicles are active, idle, or under maintenance gives you the data you need to act on utilization insights without delay. Whether you're running a single location or a multi-site operation, you can explore how Nomora fits your specific business model through the platform use cases page. Reducing idle assets and tightening your scheduling starts with having the right data in front of you at the right time.
FAQ
What is fleet utilization in simple terms?
Fleet utilization measures how much of your fleet's available capacity is being used for productive work, expressed as a percentage. It is calculated by dividing productive hours by total available hours and multiplying by 100.
What is a good fleet utilization rate?
Most corporate fleet operations target a utilization rate of 75-80%. Rates above 90% can signal insufficient buffer capacity, which increases operational risk during demand peaks or maintenance surges.
How is fleet utilization different from fleet availability?
Fleet availability measures how many scheduled hours a vehicle is operational versus in downtime or maintenance. Fleet utilization measures how many of those available hours are spent doing productive work. Both metrics are necessary but answer different questions.
What affects fleet utilization most?
The biggest factors include scheduling efficiency, maintenance downtime, idle time classification, seasonal demand variation, and the accuracy of how productive versus non-productive time is recorded in your systems.
Why does accurate data matter so much for utilization metrics?
Inaccurate downtime records and misclassified idle time distort every utilization calculation that follows. Poor data quality leads to wrong conclusions about fleet size, asset performance, and scheduling needs.
Recommended
Ready to streamline your car rental business?
Book 30 minutes with the founder. We set up everything in this guide on your own vehicles, and migrate you out of Excel for free.