TL;DR:
- Tracking ARPU, NRPV, and RevPAC together provides a comprehensive view of vehicle rental profitability. Fleet managers should monitor these metrics weekly to identify utilization issues and cost inefficiencies early. Focusing on operational improvements before expanding the fleet ensures better profit margins per vehicle.
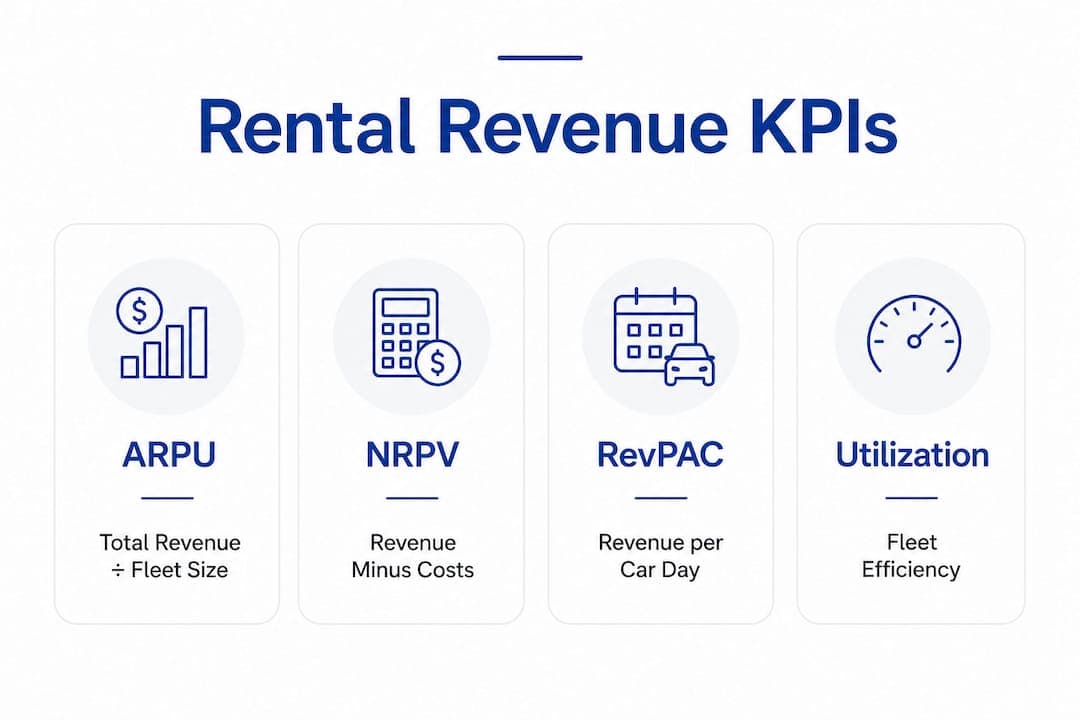
Rental revenue per vehicle calculation is the process of dividing total rental income by fleet size to measure the average income each asset generates. In the industry, this metric is formally tracked as Average Revenue Per Unit (ARPU), with related measures including Net Revenue per Vehicle (NRPV) and Revenue per Available Car Day (RevPAC). Together, these KPIs form the foundation of vehicle rental income analysis. Fleet managers who track all three gain a clear picture of pricing performance, utilization efficiency, and true per-asset profitability. Relying on total revenue alone masks the inefficiencies that quietly erode margins, especially as a fleet grows.
What data do you need for rental revenue per vehicle calculation?
Accurate per-vehicle revenue analysis starts with clean, complete inputs. Missing or delayed data produces figures that look healthy on paper but hide real problems in the field.
The core inputs for calculating vehicle rental profits are:
- Total rental revenue: All income collected during the period, including daily rates, mileage fees, insurance add-ons, and late return charges.
- Average fleet size: The average number of vehicles available during the period, not just the vehicles currently on the lot.
- Available car days: Fleet size multiplied by the number of days in the period. This figure powers the RevPAC formula.
- Variable costs: Fuel, maintenance, insurance, and cleaning costs reduce gross revenue to net revenue per vehicle. Omitting them overstates profitability.
The table below summarizes each input, its definition, and where to source it.
| Input | Definition | Data source |
|---|
| Total rental revenue | All rental income for the period | Accounting or billing system |
| Average fleet size | Mean number of vehicles across the period | Fleet management records |
| Available car days | Fleet size × days in period | Fleet scheduling system |
| Variable costs | Fuel, maintenance, insurance, cleaning | Cost tracking or expense logs |
| Downtime days | Days a vehicle was unavailable for rent | Maintenance and repair logs |
Pro Tip: Track downtime days separately from available car days. A vehicle sitting in the shop is not generating revenue, and including it in your fleet average inflates your denominator and deflates your per-vehicle figure.
Maintenance cost per mile and insurance uptake rate both affect net profitability and should sit alongside revenue KPIs in any financial review. Treating them as separate concerns leads to margin surprises at the end of the quarter.
Three formulas cover the full picture of per-vehicle rental profitability. Each answers a different question, and each has a specific use case.
ARPU: average revenue per unit
Formula: Total Rental Revenue ÷ Average Fleet Size

ARPU is the fastest calculation and the most commonly used starting point. If a fleet generates $12,000,000 in revenue across 24 vehicles over a period, ARPU equals $500,000 per vehicle for that period. The number is useful for benchmarking revenue yield but tells you nothing about how many days each vehicle actually worked.
NRPV: net revenue per vehicle
Formula: (Total Revenue − Variable Costs) ÷ Average Fleet Size
NRPV is the metric that reveals true profitability. Subtracting variable costs from total revenue before dividing by fleet size shows what each vehicle actually contributes to the bottom line. Industry benchmarks for NRPV in 2026 sit between $1,000 and $1,800 per vehicle per month. If your NRPV falls below $1,000, the business is likely absorbing costs that pricing has not accounted for.
RevPAC: revenue per available car day
Formula: Total Rental Revenue ÷ Available Car Days
RevPAC combines rate and utilization into a single figure, making it the purest measure of fleet efficiency. A fleet with high ARPU but low RevPAC is pricing well but leaving vehicles idle too often. The industry target for RevPAC typically falls between $40 and $80 per available car day.
The table below compares all three formulas side by side.
| KPI | Formula | Best used for | Limitation |
|---|
| ARPU | Total Revenue ÷ Avg. Fleet Size | Revenue benchmarking | Ignores utilization and costs |
| NRPV | (Revenue − Variable Costs) ÷ Avg. Fleet Size | Profitability analysis | Requires accurate cost data |
| RevPAC | Total Revenue ÷ Available Car Days | Fleet efficiency tracking | Does not isolate cost impact |
ARPU omits utilization; RevPAC adjusts for it, offering a purer view of asset performance. Running all three monthly gives you a complete picture that no single formula can provide on its own.
Common mistakes in calculating vehicle rental profits
Most calculation errors fall into one of three categories: incomplete data, wrong denominators, and delayed cost logging. Each one distorts the financial picture in a different direction.
- Ignoring variable costs. Calculating ARPU without subtracting fuel, maintenance, and insurance produces a gross figure that looks strong but overstates what the business actually keeps.
- Using end-of-period fleet size instead of average fleet size. If you added five vehicles in the last week of the month, your denominator should reflect the average across the full month, not the final count.
- Excluding downtime from available car days. Ignoring utilization in revenue metrics masks downtime and margin problems. A vehicle in the shop for two weeks should not count as available.
- Relying solely on ARPU. ARPU without RevPAC gives no signal about whether vehicles are sitting idle. A fleet manager who only watches ARPU can miss a utilization collapse until it shows up in cash flow.
- Delayed cost logging. Entering maintenance invoices weeks after the work is done makes monthly NRPV figures unreliable. Decisions made on stale cost data lead to pricing that does not cover actual expenses.
Revenue per vehicle is an early warning metric. Declines in NRPV or RevPAC signal inefficiencies that aggregate revenue figures will not reveal until the problem is serious. Catching a $50 drop in monthly NRPV early is far cheaper than diagnosing a margin collapse six months later.
Pro Tip: Set a weekly review cadence for RevPAC and NRPV, not just monthly. Weekly tracking catches utilization drops and cost spikes before they compound into a quarterly problem.
Reviewing your fleet utilization practices alongside revenue figures is the most reliable way to catch these blind spots early.
Calculating the numbers is only half the job. Acting on them is where profitability actually improves.
-
Set NRPV targets aligned with benchmarks. Use the $1,000–$1,800 monthly NRPV range as a baseline. If your fleet averages below $1,000, identify whether the gap comes from low rates, high costs, or poor utilization before making any changes.
-
Use RevPAC as your pricing signal. A falling RevPAC with stable rates means utilization is dropping. A rising RevPAC with falling rates means demand is strong enough to support a price increase. Adjust your vehicle rental pricing strategy based on which direction RevPAC is moving.
-
Quantify the impact of small rate changes. Increasing ARPU by $5 on a 50-car fleet generates an additional $91,250 annually. That figure makes the case for rate testing far more clearly than a general argument about "pricing improvements."
-
Redesign workflows before expanding the fleet. Scaling a fleet without redesigning workflows amplifies bottlenecks and downtime, which depresses revenue per vehicle even as total revenue grows. Fix the operational model first, then add vehicles.
-
Integrate inventory and cost controls. High-performing fleets track maintenance cost per vehicle and flag units that consistently underperform on NRPV. Retiring or repositioning low-yield vehicles often improves per-unit revenue faster than adding new ones.
-
Track EBITDA and cash runway alongside per-vehicle KPIs. Successful rental businesses track multiple KPIs weekly and monthly, using EBITDA and minimum cash runway metrics in addition to revenue per vehicle. Per-vehicle metrics tell you about asset productivity; EBITDA tells you whether the business model is financially sound.
Pro Tip: Build a simple monthly dashboard with ARPU, NRPV, RevPAC, and fleet utilization rate side by side. Four numbers reviewed together reveal patterns that any single metric hides on its own.
Poor operational design during fleet growth reduces revenue per vehicle by causing utilization instability and increasing downtime. Address the process before the headcount.
Connecting these insights to your broader car rental profitability strategies creates a feedback loop where financial data drives operational decisions, not the other way around.
Key Takeaways
Accurate rental revenue per vehicle calculation requires tracking ARPU, NRPV, and RevPAC together, because no single formula captures both pricing performance and utilization efficiency.
| Point | Details |
|---|
| Use three KPIs, not one | ARPU, NRPV, and RevPAC each answer a different question about per-vehicle performance. |
| Subtract variable costs | NRPV is the profitability metric; ARPU without cost deduction overstates what the business keeps. |
| Target $1,000–$1,800 NRPV | Industry benchmarks for monthly net revenue per vehicle sit in this range for healthy operations. |
| Fix operations before scaling | Adding vehicles without redesigning workflows depresses per-vehicle revenue even as total revenue grows. |
| Review weekly, not monthly | Weekly RevPAC and NRPV tracking catches utilization drops and cost spikes before they compound. |
Why I think most fleet managers are tracking the wrong number
Fleet managers almost universally lead with total revenue. It is the number that appears on the dashboard, the number that gets reported to owners, and the number that feels like progress when it goes up. The problem is that total revenue can grow while per-vehicle profitability quietly collapses.
I have seen this pattern play out repeatedly. A rental business adds ten vehicles, total revenue climbs, and everyone celebrates. Six months later, NRPV has dropped by $300 per vehicle because the new units are sitting idle three days a week and maintenance costs were never properly accounted for in the pricing model. The business is bigger and less profitable at the same time.
The fix is not complicated, but it requires discipline. RevPAC is the number I would watch first if I were running a fleet. It forces you to account for both rate and utilization in a single figure. When RevPAC drops, something is wrong, and you have to find out whether it is a pricing problem, a demand problem, or an operational problem before you can fix it.
The other habit worth building is separating cost tracking from revenue tracking. Most small operators log revenue daily and costs whenever invoices arrive. That gap makes monthly NRPV figures unreliable. Closing that gap, even partially, with a cloud-based platform that captures costs in real time, changes the quality of every financial decision you make.
— Dizzy
How Nomora helps you track and improve per-vehicle revenue
Rental businesses that move from spreadsheets to a dedicated platform gain something that formulas alone cannot provide: real-time visibility into every variable that affects per-vehicle profitability.
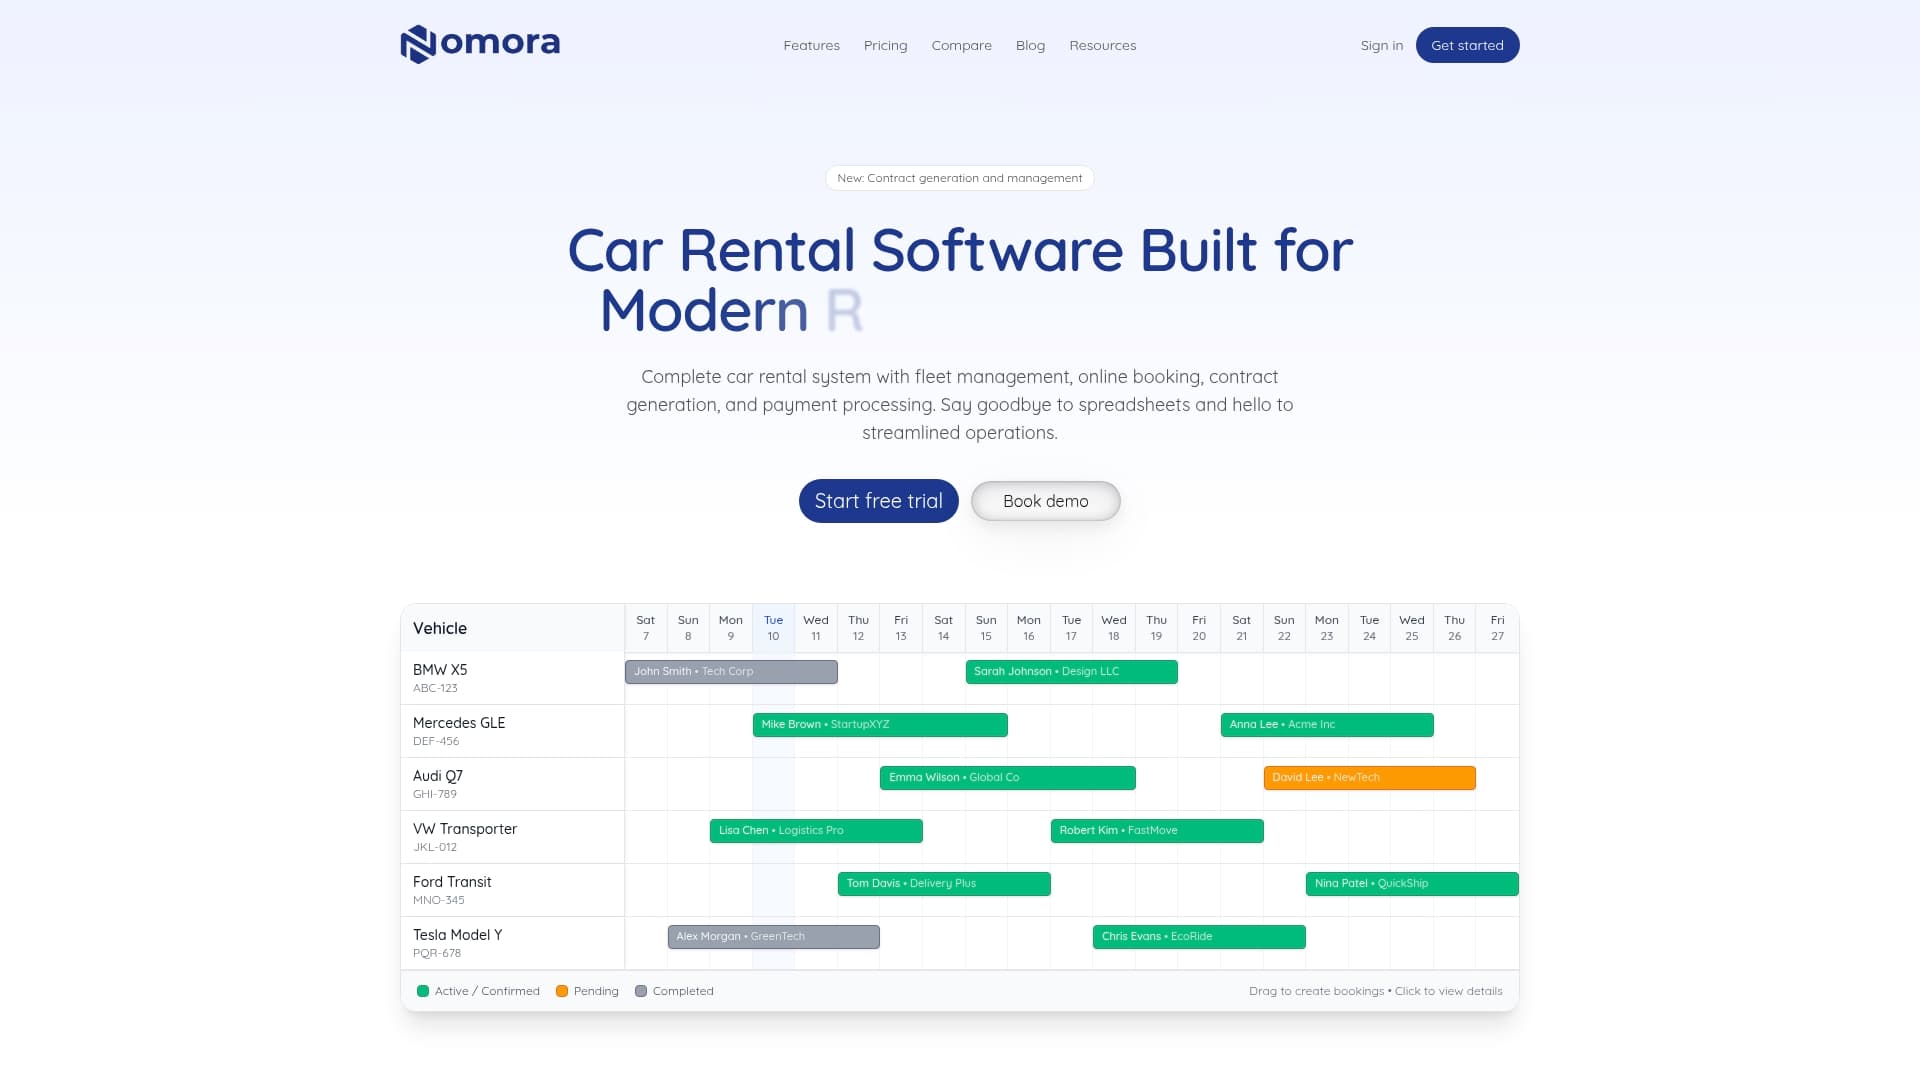
Nomora acts as the central nervous system of a rental operation, connecting reservations, fleet status, contracts, payments, and cost data in one place. Its built-in analytics surface ARPU, NRPV, and RevPAC automatically, so fleet managers spend less time building reports and more time acting on them. Automated cost logging closes the gap between when expenses occur and when they appear in your financial picture. Fleet managers across business types use Nomora's rental management tools to reduce downtime, tighten pricing decisions, and protect per-vehicle margins as their fleets grow.
FAQ
What is rental revenue per vehicle?
Rental revenue per vehicle is the total rental income divided by the average number of vehicles in a fleet over a given period. It measures how much revenue each asset generates on average.
What is the difference between ARPU and NRPV?
ARPU divides total revenue by fleet size without accounting for costs. NRPV subtracts variable costs such as fuel, maintenance, and insurance before dividing, making it the more accurate profitability metric.
What is a good RevPAC for a rental fleet?
Industry benchmarks place RevPAC between $40 and $80 per available car day. A figure below $40 typically signals underutilization, low rates, or both.
How does fleet size affect per-vehicle revenue?
Adding vehicles without improving operational workflows tends to reduce per-vehicle revenue. Downtime and maintenance challenges scale with fleet size when processes are not redesigned to match the larger operation.
How often should fleet managers calculate these KPIs?
Weekly tracking of RevPAC and NRPV is the most effective cadence. Monthly reviews catch trends, but weekly data identifies utilization drops and cost spikes early enough to act on them.
Recommended
Ready to streamline your car rental business?
Book 30 minutes with the founder. We set up everything in this guide on your own vehicles, and migrate you out of Excel for free.