TL;DR:
- Rentability analysis evaluates how effectively rental assets generate income relative to costs and market value.
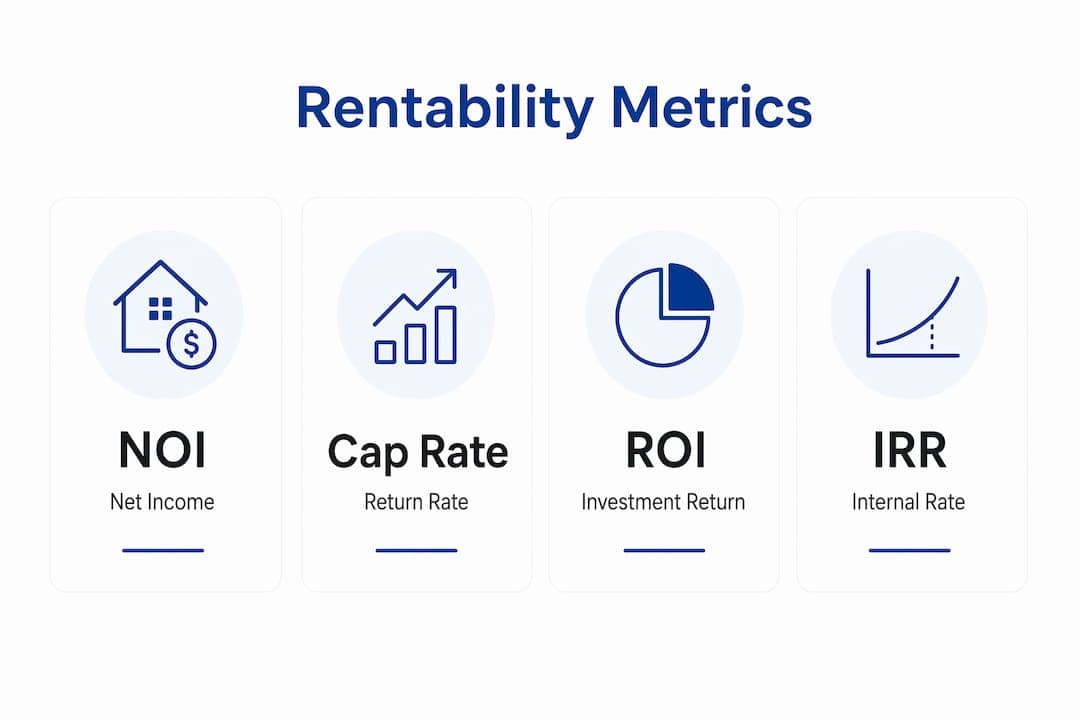
- Key metrics include NOI, Cap Rate, and ROI, which must be analyzed together for accurate assessments.
- A stabilized NOI bridge adjusts raw income data, making long-term projections more reliable and defendable.
Rentability analysis is the systematic process rental business owners use to evaluate how effectively their assets generate income relative to operational costs and market value. The industry term for this practice is profitability analysis, though "rentability analysis" captures the asset-specific focus that rental operators need. Key performance indicators in this process include Net Operating Income (NOI), Cap Rate, and Return on Investment (ROI), along with operational benchmarks like vacancy rates and capital expenditure reserves. Applying this framework tells you which assets are underperforming, where revenue is leaking, and how to make decisions that hold up over multiple years. This guide gives you the complete framework, updated for 2026 standards.
What is rentability analysis and which metrics does it use?
Rentability analysis measures income-generating efficiency by comparing revenue, costs, and market value at the asset level. Three core metrics form the foundation of any credible profitability assessment.

Net Operating Income (NOI) is gross rental income minus all operating expenses, excluding mortgage payments. It is the clearest measure of what a rental asset actually earns from operations. Capitalization Rate (Cap Rate) divides NOI by the property's current market value, expressing the return as a percentage. Return on Investment (ROI) measures net profit as a percentage of total capital invested, giving you a broader view of capital efficiency.
Operational benchmarks complete the picture. Vacancy rates typically fall between 5% and 10% for well-managed rental assets. Capital expenditure reserves generally run 5%–8% of gross rent. These benchmarks set the floor for what "normal" looks like before you start comparing your numbers.
| Metric | Formula | Healthy benchmark |
|---|---|---|
| Net Operating Income (NOI) | Gross income minus operating expenses | Positive and growing year over year |
| Cap Rate | NOI divided by market value | Varies by market; 5%–10% is common |
| Return on Investment (ROI) | Net profit divided by total investment | Above cost of capital |
| Vacancy rate | Vacant units divided by total units | 5%–10% |
| Capex reserve | Reserve as a percentage of gross rent | 5%–8% |
The metrics above interact. A strong NOI with a high vacancy rate signals pricing power but occupancy risk. A low Cap Rate in a rising market may still represent a sound hold. No single number tells the full story. Analyzing profitability means reading all of them together.
How does the stabilized NOI bridge improve accuracy?
Raw income data from a rent roll is almost never the right number to use in a rentability assessment. Professional rentability analysis requires a stabilized NOI bridge, which adjusts in-place income figures to reflect what the asset would earn under normal, recurring conditions.
The bridge works through four adjustments:
- Mark-to-market rent adjustment. This step replaces below-market in-place rents with current market rents. Analysts typically see 0%–20% variance in these adjustments depending on lease structure and how long tenants have been in place.
- Normalized operating expenses. One-time costs, such as a major repair or a legal settlement, are removed. Recurring costs are restated at their expected annual run rate.
- Recurring capex reserves. A standard reserve for ongoing capital needs is added back in. Skipping this step overstates true earnings.
- Loss-to-lease calculation. This metric measures rent upside potential. The formula is: (Market Rent minus In-Place Rent) divided by Market Rent, multiplied by 100. A property with a $1,200 market rent and a $1,080 in-place rent carries a 10% loss-to-lease, meaning 10% of potential income is currently uncaptured.
Pro Tip: Ignoring the stabilized NOI bridge leads to overstated income figures. Normalized profit metrics are the only reliable basis for pricing decisions and long-term growth planning.
Experienced rental asset managers treat the stabilized NOI bridge as non-negotiable. It converts a raw data snapshot into a defensible, recurring income figure that holds up under scrutiny.
What advanced metrics support multi-year rentability assessment?
Single-year NOI calculations are useful starting points, but they are insufficient for strategic planning. Dynamic models that incorporate rent growth, expense inflation, and loan amortization over a 3–5 year hold period produce far more reliable insights than any static annual figure.
Total Return captures both income and asset appreciation over the holding period. Internal Rate of Return (IRR) goes further by accounting for the time value of money, expressing the annualized return on every dollar invested across the entire hold. These two metrics together answer the question that NOI alone cannot: is this asset worth holding, and for how long?
Standard underwriting for conventional rental assets assumes down payments of 20%–25%, with operating expenses often running 8%–10% of gross income, excluding mortgage payments. These figures serve as calibration points when building a multi-year model.
Common pitfalls in short-term focused rentability assessments include:
- Ignoring expense inflation. Costs rise. A model that holds expenses flat overstates future NOI.
- Using unadjusted gross rent. Gross rent is not collected rent. Economic vacancy always reduces actual income.
- Omitting refinancing scenarios. Interest rate changes alter cash flow materially over a 5-year hold.
- Relying on property-wide averages. Aggregate figures mask unit-level performance gaps that matter for pricing and capital allocation.
Pro Tip: Build your model to run at least three scenarios: base case, downside, and upside. A rental revenue management framework that accounts for market shifts protects you from decisions based on best-case assumptions alone.
How to perform granular rent roll analysis to find revenue leakage
A rent roll is a record of every rental unit, its current tenant, lease terms, and the rent being collected. Analyzing a rent roll means evaluating that data at the unit level to determine current income, occupancy health, and upside potential.
The distinction between physical and economic occupancy is critical. Physical occupancy counts occupied units as a percentage of total units. Economic occupancy measures collected rent as a percentage of gross potential rent. A property can show 95% physical occupancy while economic occupancy sits at 82%, because concessions, delinquencies, and below-market leases reduce actual cash flow.
Steps to conduct a thorough rent roll analysis:
- Map every unit by type. Group units by size, location, or vehicle class in a car rental context. Averages across unlike assets hide the real picture.
- Calculate loss-to-lease per unit type. A 6% average loss-to-lease property-wide is misleading. Specific unit types may carry 15% loss-to-lease while others sit at market, requiring very different responses.
- Flag lease expiration clusters. A large share of leases expiring in the same month creates concentrated vacancy risk. Staggering renewals reduces that exposure.
- Identify below-market rents. Long-term tenants often pay rates set years ago. Quantifying the gap tells you exactly how much income is being left on the table.
- Review concession patterns. Frequent free-period concessions signal weak demand or poor pricing strategy, not just generosity.
Unit-level rent roll analysis is the only method that reveals specific revenue leakages and differentiates rent growth opportunities from aggregate averages that obscure them.
Pro Tip: Use rent roll findings to directly inform your rental pricing strategy. Units with high loss-to-lease are candidates for rate increases at renewal. Units with high vacancy need demand analysis, not automatic discounting.
Operational factors also shape the numbers. Tenant experience and community quality are hidden drivers of vacancy risk and income stability. A rent roll that looks healthy today can deteriorate quickly if the underlying demand drivers are weak. Evaluation of rentability is never purely a spreadsheet exercise.
Key takeaways
Rentability analysis requires NOI, Cap Rate, ROI, and a stabilized NOI bridge working together to produce a defensible, recurring income figure that supports sound decisions.
| Point | Details |
|---|---|
| Core metrics matter together | NOI, Cap Rate, and ROI must be read as a set, not in isolation. |
| Stabilized NOI bridge is non-negotiable | Adjust raw income for market rents, normalized expenses, and capex reserves before drawing conclusions. |
| Multi-year models outperform snapshots | IRR and Total Return over a 3–5 year hold reveal capital efficiency that annual figures cannot. |
| Unit-level analysis prevents blind spots | Property-wide averages mask loss-to-lease and vacancy risk that only granular rent roll review exposes. |
| Operational factors drive financial outcomes | Tenant experience and demand strength affect vacancy rates and income stability over time. |