TL;DR:
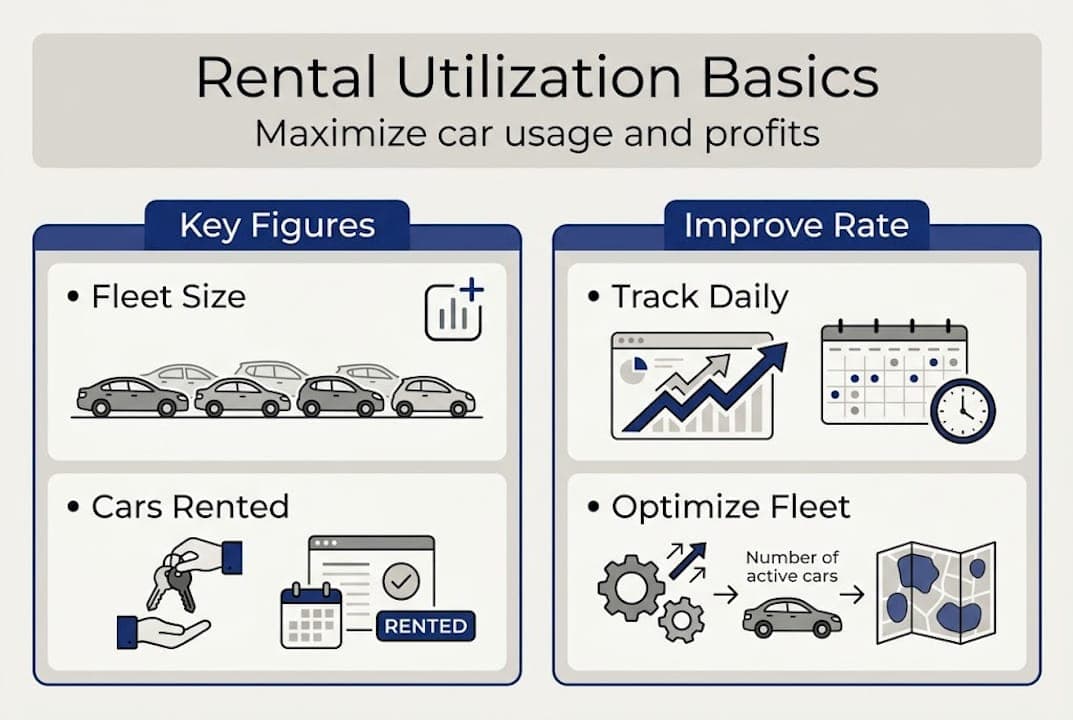
- Rental utilization measures the percentage of fleet rental days over a period, reflecting operational efficiency.
- Optimizing utilization involves disciplined management, dynamic pricing, proactive maintenance, and real-time data tools.
- Most owners underperform due to system inefficiencies and lack of operational discipline rather than fleet size.
Many rental business owners assume a full fleet means a profitable fleet. It does not. You can have 30 cars sitting in your lot, all technically "available," and still be losing money every single day. Rental utilization measures what percent of your fleet is truly earning for you, not just available. This guide covers exactly what rental utilization means, how to calculate it accurately, what benchmarks you should be hitting, and the specific strategies that help small and medium operators close the gap between average and excellent performance.
Table of Contents
- What is rental utilization in car rental?
- How do you calculate your rental utilization rate?
- What are typical utilization benchmarks and what affects them?
- How can you improve your rental utilization?
- Why most owners miss out on true utilization gains
- Streamline your utilization management with smart solutions
- Frequently asked questions
Key Takeaways
| Point | Details |
|---|---|
| Utilization rate matters most | Measuring how much your fleet is actually rented directly impacts profitability. |
| Standard formulas clarify performance | Always use percentage-based measurements for accurate, comparable results. |
| Benchmarks guide growth | Compare your rates with industry averages to spot strengths and opportunities. |
| Small fleets can outperform | Smart management often achieves higher utilization than industry giants. |
| Operational discipline drives success | Regular tracking, flexible pricing, and automation are key to sustained high utilization. |
What is rental utilization in car rental?
Rental utilization, also known as the fleet utilization rate, is the core performance metric every car rental operator needs to understand. According to industry standards, fleet utilization rate measures the percentage of time or days that vehicles in a car rental fleet are rented out compared to the time they are available for rent. It is not about how many cars you own. It is about how many of those cars are actively generating revenue at any given time.
This distinction matters more than most operators realize. A business with 50 vehicles and a 60% utilization rate is effectively running on 30 cars. A competitor with 30 vehicles and an 85% utilization rate is generating more billable days with a smaller, leaner fleet. The math is straightforward, but the operational implications are significant.
Utilization is often confused with occupancy, which typically refers to a snapshot of how many cars are on rent right now. Utilization is broader. It reflects performance over a defined period, such as a day, week, or month, and gives you a much more reliable picture of fleet efficiency. Familiarity with rental industry terms like these helps operators avoid costly misinterpretations when reviewing their own data.
Here is what your utilization rate actually reveals:
- Fleet earning power: How much of your capital investment is working for you vs. sitting idle
- Hidden inefficiencies: Vehicles stuck in maintenance, poorly scheduled returns, or gaps between bookings
- Seasonal performance: How your fleet responds to demand shifts across the year
- Fleet mix problems: Whether certain vehicle classes consistently underperform relative to others
"Rental utilization, also known as fleet utilization rate, measures the percentage of time or days that vehicles in a car rental fleet are rented out compared to the time they are available for rent." — Car Rental Fleet Utilization Explained
Pro Tip: Before you consider expanding your fleet, audit your current utilization rate. If you are below 75%, adding more vehicles will only dilute your numbers further. Maximize what you have first.
The bottom line is that utilization is the most honest indicator of operational health in a rental business. It connects directly to revenue, depreciation management, and long-term profitability in ways that raw fleet size simply cannot.
How do you calculate your rental utilization rate?
Understanding the concept is one thing. Calculating it accurately is another. The standard formula for rental utilization is:
Utilization Rate (%) = (Number of cars on rent / Active fleet size) × 100
This sounds simple, but the accuracy of your result depends entirely on how you define "active fleet." Vehicles currently in long-term maintenance, awaiting disposal, or held off-road for any reason should not count toward your active fleet size. Including them artificially deflates your utilization rate and gives you a misleading picture of real performance.
Here is a step-by-step approach to calculating your rate correctly:
- Define your active fleet. Count only vehicles that are roadworthy, insured, and available for rental. Exclude anything in the shop for more than 48 hours.
- Track daily rentals. Record how many vehicles are on rent each day of the period you are measuring.
- Apply the formula. Divide cars on rent by your active fleet size, then multiply by 100.
- Aggregate over time. Calculate daily rates and average them across the week or month for a reliable trend.
- Segment by vehicle class. Break down results by car type to identify which segments are pulling weight and which are not.
Here is a sample weekly calculation for a fleet of 20 active vehicles:
| Day | Cars on rent | Active fleet | Utilization rate |
|---|---|---|---|
| Monday | 14 | 20 | 70% |
| Tuesday | 15 | 20 | 75% |
| Wednesday | 17 | 20 | 85% |
| Thursday | 16 | 20 | 80% |
| Friday | 18 | 20 | 90% |
| Saturday | 19 | 20 | 95% |
| Sunday | 13 | 20 | 65% |
| Weekly avg | 16 | 20 | 80% |
This weekly average of 80% is a strong result. It also reveals a clear pattern: Sunday and Monday are your weakest days, which points directly to where targeted promotions or pricing adjustments could make a real difference.
It is worth noting that some models use alternative calculations that can produce figures above 100%, sometimes labeled "600% utilization" when counting total occupied days across a fleet. These are not standard and make cross-business comparison nearly impossible. Stick to the percentage model for accurate benchmarking.
Common mistakes operators make include counting vehicles that are technically registered but not operational, failing to update the active fleet count after acquisitions or disposals, and measuring utilization only at peak times rather than averaging across the full period. Reviewing fleet reporting basics can help you build a consistent tracking system. For a broader operational context, the fleet management guide outlines how reporting fits into day-to-day operations.
Pro Tip: Calculate your utilization rate as a monthly average, not just a weekly snapshot. Monthly averages smooth out anomalies like holidays or unusual weather events and give you a more accurate baseline for decision-making.
Reviewing fleet optimization examples from similar-sized operators can also help you validate whether your calculation approach aligns with industry practice.
What are typical utilization benchmarks and what affects them?
Now that you can measure your rate, you need to know what good looks like. Industry benchmarks show that the global average fleet utilization in 2023 was approximately 78%, with high-season peaks reaching 90 to 95% and off-peak periods dropping to 60 to 65%. These figures give you a realistic range to work within, not a single number to chase blindly.
Here is how utilization typically varies across fleet size, vehicle class, and location type:
| Segment | Average utilization | Notes |
|---|---|---|
| Small fleet (under 20) | 65-72% | Higher variance, management-dependent |
| Medium fleet (20-60) | 75-82% | Best opportunity for gains |
| Large fleet (60+) | 78-85% | More stable, data-driven |
| Economy/compact cars | 82-90% | Consistently highest demand |
| SUVs | 70-78% | Seasonal peaks in family travel |
| Premium/luxury | 55-68% | Niche demand, lower baseline |
| Airport locations | 80-88% | High turnover, strong demand |
| Suburban locations | 65-75% | More dependent on local marketing |
Economy and compact cars consistently achieve the highest utilization rates, while premium and specialty vehicles run lower on average. Airport locations outperform suburban ones due to consistent traveler demand and higher booking volumes.
Several key factors influence where your business lands within these ranges:
- Vehicle class mix: A fleet heavy in premium vehicles will naturally show lower utilization than one focused on economy cars
- Seasonality: Tourism-dependent markets see dramatic swings between peak and off-peak periods
- Location type: Airport operations benefit from steady corporate and leisure travel demand
- Business focus: B2B fleet rentals often produce steadier utilization than pure leisure-focused operations
- Booking lead time: Last-minute booking markets tend to have more utilization volatility
Understanding these variables helps you set realistic targets. A suburban operator with a mixed fleet should not benchmark against an airport economy-car specialist. Reviewing inventory management strategies can help you align your fleet composition with actual local demand patterns.