TL;DR:
- Effective fleet allocation involves deliberate vehicle assignment to maximize revenue and minimize idle time. Continuous, data-driven management ensures better utilization, higher profitability, and adaptability to market shifts. Using advanced tools and KPIs, operators can optimize vehicle mix, rebalancing, and pricing for sustained rental success.
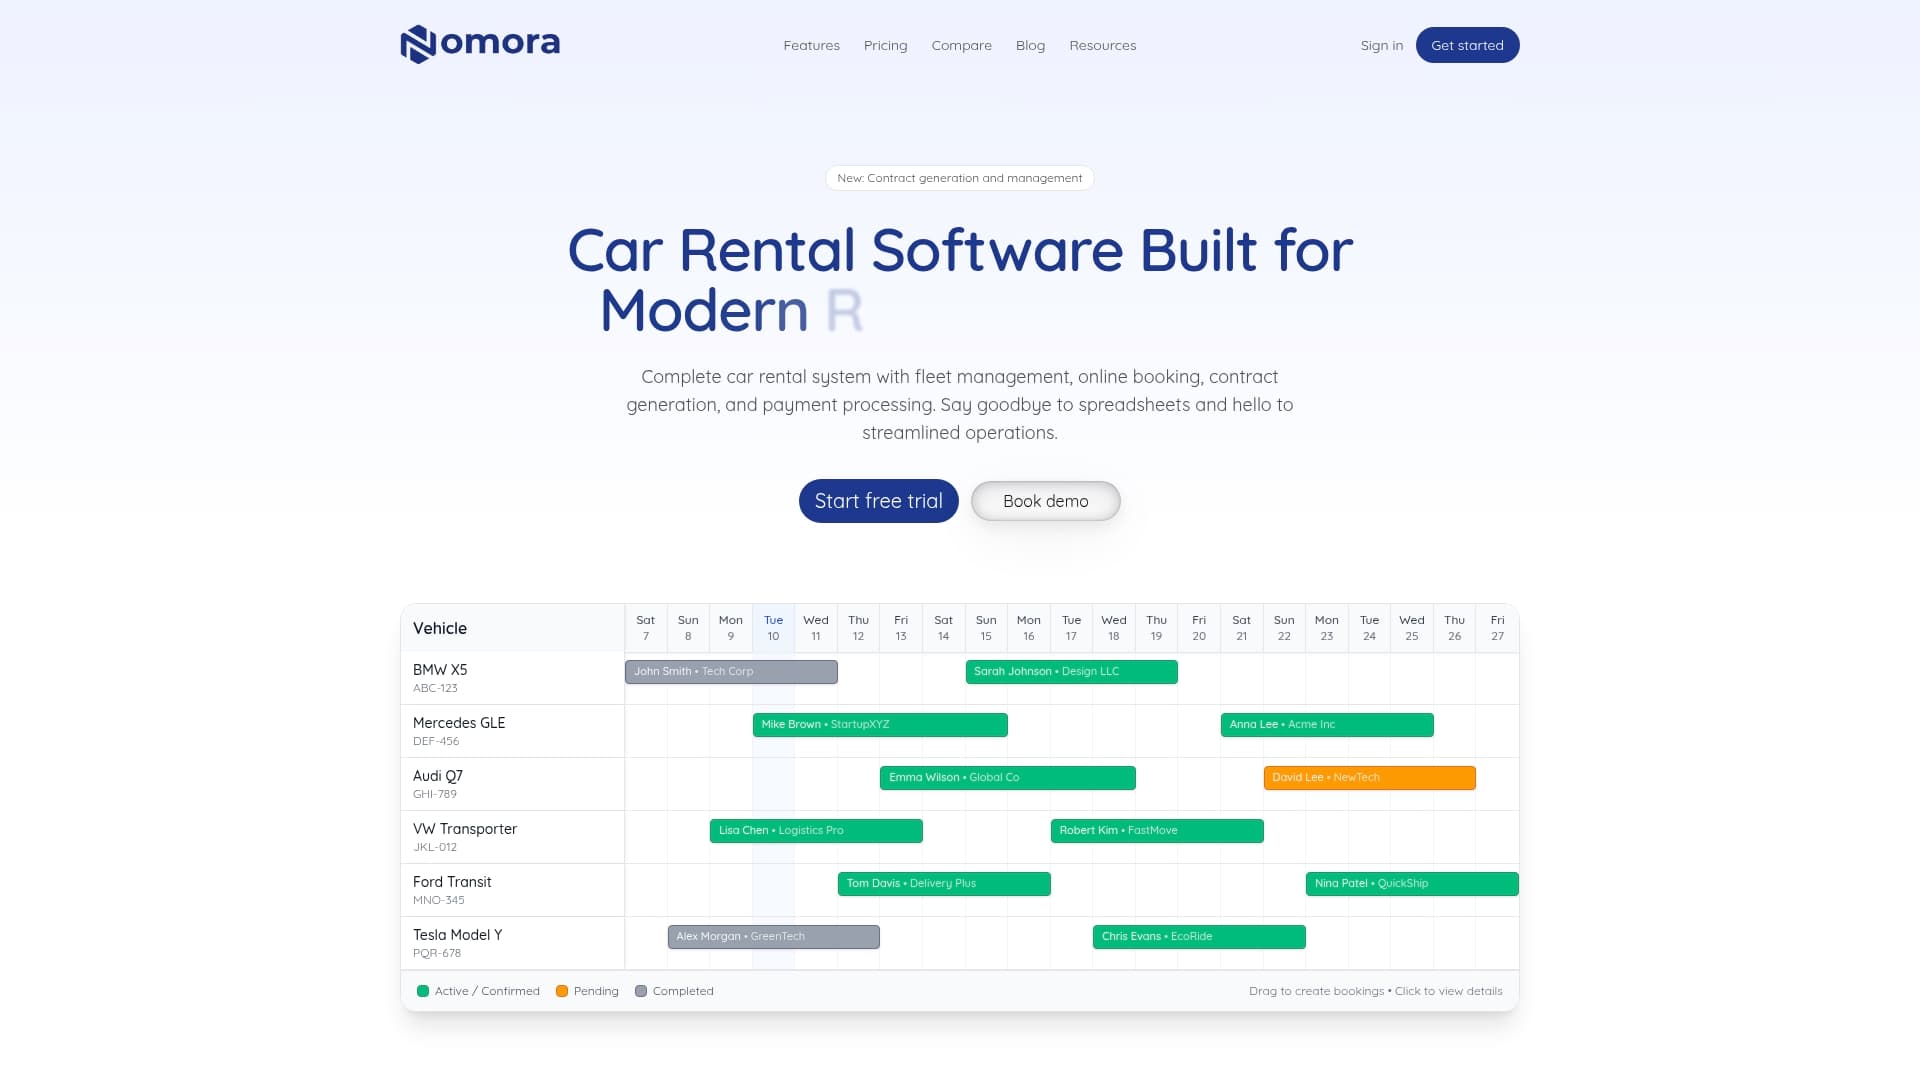
Running a busy fleet feels like success. But a fleet rented at 88% capacity can still underperform a competitor operating at 75% if that competitor places the right vehicles in the right locations at the right price points. Car rental fleet utilization benchmarks show that small and medium fleets of 20 to 60 vehicles can hit 82% average daily utilization through focused management, yet many operators leave significant revenue on the table by treating allocation as an afterthought. This article breaks down the strategies, benchmarks, and practical tools that turn a busy fleet into a genuinely profitable one.
Table of Contents
- Why fleet allocation matters for rental profitability
- Core strategies for optimal fleet allocation
- Utilization benchmarks and measuring allocation success
- Advanced tactics: Overbooking, rebalancing, and adaptation
- What most rental fleet guides miss about allocation
- Turn insights into action with fleet management solutions
- Frequently asked questions
Key Takeaways
| Point | Details |
|---|---|
| Strategic allocation drives profit | Effective fleet allocation, not just utilization, is essential for maximizing revenue and minimizing costs in rental car operations. |
| Blend core and advanced tactics | Combining forecasting, pricing, rebalancing, and data-driven overbooking leads to higher efficiency and flexibility. |
| Follow industry benchmarks | Track daily and seasonal utilization rates and regularly benchmark your fleet against industry standards to gauge success. |
| Continuous review is vital | Frequent analysis and adjustment of allocation strategies outperforms a 'set and forget' approach every time. |
Why fleet allocation matters for rental profitability
Fleet allocation is the deliberate process of assigning specific vehicles to specific locations, time windows, and customer segments to maximize both revenue and operational efficiency. It goes well beyond simply keeping cars rented. Poor allocation creates a cascade of problems that erode margins quietly and consistently.
Idle assets are the most visible symptom. A compact sedan sitting unused at a suburban branch while the airport location turns away economy bookings is a direct profit leak. Less obvious is overbooking bleed, where mismatched supply creates upgrade costs, customer dissatisfaction, and administrative overhead that eat into margin. There are also missed premium opportunities, where high-margin SUVs or specialty vehicles end up parked while lower-margin economy units churn through high-demand periods.
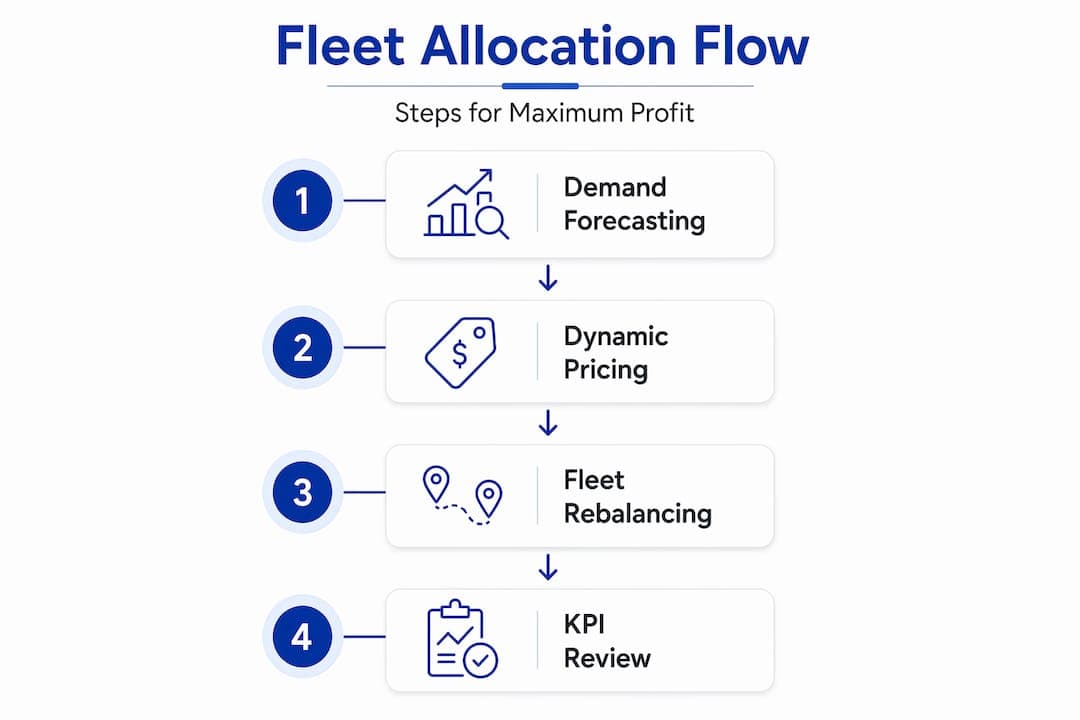
Fleet allocation strategies for rental companies center on four interlocking disciplines: demand forecasting, dynamic pricing, fleet rebalancing, and vehicle class optimization. Each one supports the others. Forecasting informs pricing decisions. Pricing signals feed back into rebalancing priorities. Class optimization shapes the entire vehicle mix.
The tangible benefits of getting this right include:
- Lower idle time across all vehicle classes and locations
- Higher revenue per vehicle through better price positioning
- Reduced upgrade costs from accurate demand matching
- Faster response to seasonal shifts without reactive over-purchasing
- Stronger customer satisfaction when availability matches expectations
Understanding these benefits through fleet utilization reporting and sharp rental inventory insights is where sustainable improvement begins.
Core strategies for optimal fleet allocation
Effective fleet allocation is not a single tactic. It is a system of interconnected strategies that reinforce each other over time. Here is how each one works in practice.
Demand forecasting uses historical booking data, seasonal trends, local events, and market signals to predict how many vehicles of each class will be needed at each location on any given day. Accurate forecasting prevents both under-supply, which turns away revenue, and over-supply, which creates idle costs. Demand forecasting tools built into modern rental management platforms automate much of this analysis in real time.
Dynamic pricing adjusts rental rates based on current demand, availability, and competitive positioning. Rather than holding a flat daily rate, dynamic pricing captures premium revenue during high-demand windows and stimulates bookings during slow periods. Rental pricing strategies that incorporate dynamic adjustments consistently outperform flat-rate models across all fleet sizes.
Fleet rebalancing is the physical or logistical movement of vehicles between locations to correct supply imbalances before they become revenue problems. A branch with too many compact cars and a surplus of weekend demand at another location creates an obvious rebalancing opportunity, provided the transport cost is justified.
Vehicle class optimization ensures that the overall mix of economy, mid-size, premium, and specialty vehicles reflects actual demand patterns rather than historical buying habits. Many fleets carry too many economy units because they were cheap to acquire, not because they are the most profitable to rent.
Core steps for each strategy:
- Forecasting: Analyze 12 to 24 months of booking history, segment by vehicle class and location, then layer in event calendars and seasonal indexes.
- Dynamic pricing: Set floor and ceiling rates per class, define trigger thresholds (e.g., below 40% availability activates surge pricing), and review results weekly.
- Rebalancing: Map surplus and deficit locations daily, calculate net revenue gain after transport cost, and action only positive-gain moves.
- Class optimization: Review revenue per vehicle by class quarterly, retire low-performers, and adjust acquisition or lease plans accordingly.
Pro Tip: For unpredictable demand, a hybrid fleet mix combining owned vehicles for stable baseline demand, leased vehicles for growth periods, and short-term rented units for peak surges can significantly reduce idle asset risk without locking up capital.
| Acquisition model | Best for | Flexibility | Cost profile |
|---|---|---|---|
| Owned | Stable, predictable demand | Low | High upfront, low ongoing |
| Leased | Steady growth, medium-term | Medium | Predictable monthly |
| Rented (short-term) | Peak demand and seasonal spikes | High | Premium per unit |
| Hybrid mix | SMEs with variable demand | High | Balanced across the cycle |
Fleet rotation and revenue management data shows that dynamic pricing and forecasting together can boost utilization by 3-25%, while MIP (Mixed Integer Programming) revenue models increase revenue per car by 2 to 8%. Even without advanced modeling, systematic application of these four strategies produces measurable gains within two to three rental cycles.
Utilization benchmarks and measuring allocation success
Knowing what good looks like is essential before you can manage toward it. Industry data provides a clear baseline for small and medium rental operations.
| Metric | Off-peak target | Average daily target | Peak season target |
|---|---|---|---|
| Fleet utilization rate | 55-65% | 70-79% | 90-95% |
| SME focused management | 60-70% | 82% | 90%+ |
| Revenue per vehicle/day | Variable | Benchmark to market | +15-20% above average |
| Idle days per vehicle/month | Less than 8 days | Less than 6 days | Less than 3 days |
"Small and medium rental fleets of 20 to 60 vehicles can achieve 82% average daily utilization through focused management" — this is not an aspirational figure. It is a documented outcome from operators who treat allocation as an active discipline rather than a passive result.
Measuring allocation success requires tracking the right indicators. Here are the four KPIs that matter most:
- Fleet utilization rate: The percentage of available vehicle-days actually rented. This is your primary efficiency signal, but it must be read alongside profitability data to avoid chasing numbers at the expense of margin.
- Revenue per vehicle per day (RevPVD): Combines utilization and pricing into a single profit-oriented metric. A vehicle rented at 60% utilization at premium rates can outperform one rented at 85% at discounted rates.
- Idle days per vehicle: Measures how many days each vehicle sits unrented in a given period. Breaking this down by vehicle class and location reveals allocation gaps immediately.
- Vehicle turnover speed: How quickly a returned vehicle is inspected, prepared, and made available for the next booking. Slow turnaround artificially suppresses utilization even when demand is strong.
Tracking fleet KPIs with precision, and reviewing them against fleet utilization best practices, separates operators who improve consistently from those who react only when problems are already visible.
A common pitfall is tracking total utilization as the only success measure while ignoring per-class or per-location breakdowns. A 78% aggregate figure can mask a premium segment running at 45% while economy units hit 95%, which means the most profitable vehicles sit idle during the periods when customers are willing to pay the most.