Twelve metrics tell you whether your fleet is making money or quietly bleeding it. In order of urgency: fleet utilization rate, vehicle utilization rate, time-based (revenue-generating) utilization versus ignition-on time, deadhead or empty-mile percentage, idle time percentage, downtime percentage, reservations per vehicle, miles per vehicle per day, cost per vehicle-day (or cost per idle day), revenue per vehicle, utilization variance across depots or asset types, and preventive maintenance (PM) compliance.
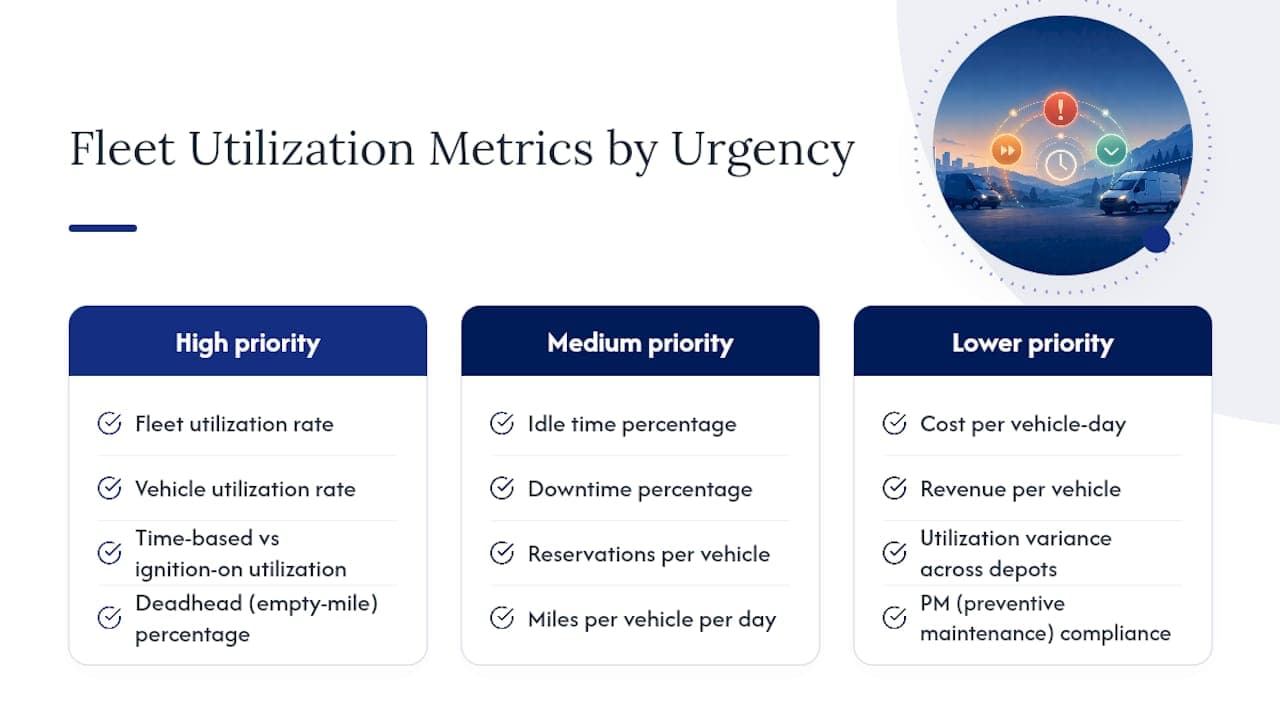
The single-sentence verdict: for most fleets, downtime and availability move the needle first, deadhead or empty miles move it second, and utilization variance across depots exposes the operational gaps that raw averages hide. These aren't abstractions. Trackunit's utilization framework treats mechanical availability as the hard ceiling on utilization, and Agile Fleet's benchmarking guide recommends tracking multiple metrics together because a single percentage hides the operational drivers behind it.
Pro Tip: If you can only build one dashboard this quarter, build it around downtime percentage and deadhead percentage. Everything else is easier to fix once those two are visible.
Key Takeaways
Fleet utilization improves fastest when managers fix downtime and deadhead miles before chasing smaller optimizations, and when every metric shares one written availability definition.
| Point | Details |
|---|
| Start with two metrics | Downtime percentage and deadhead percentage typically move the needle first for most fleets. |
| Lock the definition | Write down what counts as "available" and "utilized" once, and apply it consistently across every report. |
| Benchmark internally | Compare your best depot against the rest of your fleet rather than relying on published industry averages. |
| Act on the 50% rule | Vehicles under 50% utilization for three or more months are strong candidates for redeployment or sale. |
| Automate the connections | Nomora links reservation, GPS, and maintenance data so utilization metrics update without manual reconciliation. |
Table of Contents
Get the denominator wrong and every number downstream is wrong too. Before you calculate anything, decide what counts as "available" and what counts as "utilized," write it down, and never let two people on your team use different rules for the same metric.
There are three lenses for measuring utilization, and most fleets need at least two of them. Opsima's fleet KPI breakdown frames these as time-based (hours), distance-based (miles), and capacity-based (payload or volume). A delivery fleet cares most about time and distance. A flatbed or tanker operation cares about capacity too, since a truck running half-empty is technically "utilized" but not efficiently so.
- Fleet utilization rate = (Productive Machine Hours ÷ Scheduled Machine Hours) × 100. This PMH/SMH formula, as Trackunit defines it, separates working hours from idling hours to reveal capacity you can actually recover.
- Vehicle utilization rate = Vehicles in active use ÷ Total available vehicles, expressed as a percentage.
- Deadhead percentage = Empty miles ÷ Total miles driven.
- Idle time percentage = Idle engine hours ÷ Total engine hours.
- Downtime percentage = Hours out of service (repair, unscheduled maintenance) ÷ Total scheduled hours.
- Preventive maintenance compliance = PM services completed on schedule ÷ PM services due.
- Revenue per vehicle = Total fleet revenue ÷ Number of active vehicles.
- Cost per idle vehicle-day = Fixed carrying costs (depreciation, insurance, financing) ÷ Days the vehicle sat unused.
- Miles per vehicle per day = Total miles driven ÷ (Number of vehicles × days in period).
The choices you make around "availability" swing these numbers hard. Do you count a vehicle as available 24 hours a day, or only during its assigned shift window? Does scheduled maintenance count against availability, or get excluded from the denominator entirely? Is "utilized" defined as ignition-on time, or only the hours a vehicle was generating revenue?
Here's a worked example. Say a rental vehicle sat in your lot for 30 days in a month and was booked for 21 of those days. Using a 24-hour, calendar-day availability definition: Fleet utilization rate = 21 ÷ 30 = 70%. Now exclude the 3 days it was in for scheduled maintenance from the available pool: 21 ÷ 27 = 77.8%. Same vehicle, same bookings, an 8-point swing depending purely on how you define the denominator. That's why locking down a written availability policy that your whole team references matters more than the formula itself.
What Utilization Benchmarks Should You Target?
Published industry benchmarks are notoriously slippery, and the reason isn't inconsistent fleets. It's inconsistent math. Locus's 2026 benchmarking analysis found that definitional choices, mainly how "available" and "active" get counted, can shift a reported utilization rate by more than 20 percentage points between two otherwise identical fleets.
That said, rough bands are useful as a sanity check, not gospel:
Three action zones matter more than the exact numbers. Underutilized (below roughly 50% for several consecutive months) means a vehicle is a redeployment or disposal candidate. Healthy sits within your segment's benchmark band and should trigger nothing but routine monitoring. At-risk applies when a vehicle or depot trends downward two periods in a row, which should trigger an investigation before it becomes a write-off.
The most defensible benchmark isn't a published industry number at all. It's your own best-performing depot or asset class, compared against the rest of your fleet under the same operating conditions. Oxmaint's research also puts a dollar figure on the stakes: many fleets carry 15% to 20% of vehicles underutilized at any given time, at a carrying cost of roughly $8,000 to $15,000 per idle vehicle annually.
How Should You Measure and Collect Utilization Data?
You have three practical options for collecting utilization data, and most mature fleets end up using a combination of the last two.
Manual logs work for very small fleets but degrade fast. Drivers forget to log, timestamps get rounded to the nearest hour, and there's no way to catch idle time between paper entries.
Raw telematics gives you precise GPS, ignition-on/off, and engine-hour data in real time, but it takes engineering effort to turn raw feeds into the metrics above. Providers like Geotab and Verizon Connect are widely used for this layer, and maintenance-tracking tools like AUTOsist fill the gap for PM compliance and work order status when telematics alone doesn't cover it.
Integrated fleet or rental management software connects reservation data, GPS, and maintenance records into one dashboard, which is where most of the manual reconciliation work disappears.
Whichever combination you use, the fields that matter are consistent: engine hours, ignition on/off timestamps, GPS location pings, loaded/unloaded status, odometer readings, reservation start and end times, and maintenance work order timestamps.
Collection frequency should match the decision it supports. Idle-time and deadhead alerts need real-time or near-real-time data. Daily rollups are fine for utilization tracking. Weekly or monthly aggregation is appropriate for benchmarking against your own historical baseline.
Pro Tip: Before trusting any utilization number, run a validation pass: strip out non-operational hours (vehicles in storage, awaiting registration), reconcile timestamps across systems that might be in different time zones, and flag any gap longer than 30 minutes in GPS data as a possible offline period rather than idle time.
Which Strategies Actually Move Utilization Numbers?
Not every fix carries equal weight. Ranked roughly by typical payoff:
- Tighten preventive maintenance scheduling and spare parts availability to cut downtime percentage, which directly raises the ceiling on everything else.
- Optimize routing and dispatch to reduce deadhead miles, the second-biggest lever after downtime.
- Reduce idle time through better staging, fueling locations, and pre-trip routines.
- Right-size the fleet by identifying vehicles below 50% utilization for months and moving them to rental, resale, or reassignment.
- Speed up turnaround, meaning faster inspection and fueling between uses, especially in rental and last-mile operations.
- Coach drivers and dispatchers on habits that create empty miles and unnecessary idling.
- Use dynamic dispatch or pooled vehicles for demand that fluctuates by day or season.
- Set automated underuse alerts so a vehicle sitting idle for 5+ days triggers a review instead of going unnoticed for a month.
| Action | Primary metric improved | Secondary effect |
|---|
| Tighter PM scheduling | Downtime % | Higher availability, higher utilization % |
| Route/dispatch optimization | Deadhead % | Lower cost per mile |
| Idle-time reduction | Idle time % | Lower fuel cost |
| Fleet right-sizing | Vehicle utilization rate | Lower carrying cost per vehicle |
| Faster turnaround | Reservations per vehicle | Higher revenue per vehicle |
Pro Tip: Structure a pilot in four to eight weeks: two weeks establishing a baseline, two to four weeks running the intervention, and two weeks measuring the result. If downtime sits above 15%, start there before touching dispatch or scheduling. If downtime is already under 10%, deadhead reduction usually has more headroom.
How Nomora Turns Utilization Metrics Into Action
A rental or fleet management platform earns its keep by connecting the data sources that usually live in separate systems. Reservation data feeds reservations-per-vehicle and utilization-by-reservation automatically. GPS integration supplies idle time, deadhead miles, and active hours without a manual export. The maintenance module supplies downtime and PM compliance in the same dashboard instead of a separate spreadsheet.

A typical pilot runs like this: onboarding takes 24 to 48 hours, followed by a two-week baseline period, a four-week intervention window (redeployment, schedule changes, or PM tightening), and two weeks of measurement.
| Pilot stage | What to track |
|---|
| Baseline (weeks 1–2) | Current utilization rate, deadhead %, downtime % |
| Intervention (weeks 3–6) | Reservation duration, revenue per vehicle |
| Measurement (weeks 7–8) | Utilization rate change, cost per idle vehicle-day |
What Drives Fleet Costs, and How Do You Calculate ROI?
Total cost of ownership (TCO) is the anchor figure behind every utilization decision, because a vehicle's fixed costs (financing, depreciation, insurance) accrue whether it's earning revenue or sitting in the lot. Cost per mile blends those fixed costs with variable costs (fuel, tires, maintenance) divided by miles driven, and it drops sharply as utilization rises since the fixed portion gets spread over more productive activity.
The ROI case for tracking and optimizing utilization is straightforward arithmetic once you have the carrying-cost figure. If an idle vehicle costs $8,000 to $15,000 annually in carrying costs and you identify 15 underutilized vehicles across a 100-vehicle fleet, redeploying or disposing of even half of them saves somewhere between $60,000 and $112,500 a year, without adding a single new revenue-generating asset.
The investment side of the ledger is comparatively small: telematics hardware, software subscriptions, and the staff time to build and review dashboards. Most fleets recover that investment inside two to three months once redeployment decisions start landing, because the savings come from cutting waste rather than generating new revenue. Cost-reduction tactics that pair well with utilization tracking, from renegotiated maintenance contracts to fuel-card optimization, are covered in more detail in Nomora's cost-saving strategies guide.
Which Metrics Should You Prioritize First?
Fleet size and business model determine where to start, not personal preference. A five-vehicle service fleet doesn't need the same dashboard as a 500-vehicle rental network.
Small fleets (under 25 vehicles) should prioritize vehicle utilization rate and downtime percentage first. With so few assets, a single vehicle in the shop has an outsized effect on capacity, and the fix (redeploy, rent, or repair faster) is usually obvious once the number is visible.
Mid-size fleets (25 to 250 vehicles) benefit most from segmenting by depot or asset type before drilling into any single metric. Utilization variance across locations, an approach Trackunit recommends for avoiding misleading averages, usually surfaces one or two underperforming sites that account for most of the loss.
Large fleets (250-plus vehicles) need the full stack: deadhead percentage and dispatch-driven utilization variance become the highest-value metrics because small percentage gains multiply across hundreds of assets.
Business goals matter too. If the objective is cost reduction, start with downtime and cost per idle vehicle-day. If the objective is revenue growth, start with reservations per vehicle and revenue per vehicle. Trying to fix all twelve metrics simultaneously usually means fixing none of them well.
How Do You Keep Utilization Data Accurate?
Bad data produces confident, wrong decisions, which is worse than no data at all. A few validation habits catch most of the errors before they reach a report.
Reconcile timestamps across systems before trusting any calculation. GPS pings, reservation timestamps, and maintenance work orders often live on different clocks or time zones, and a 90-minute offset can quietly inflate or deflate a downtime figure.
Set a rule for GPS gaps. A device that goes offline for six hours isn't necessarily idle, it might be in a dead zone or a parking garage. Flag gaps over a defined threshold (30 minutes is a reasonable default) for manual review rather than auto-classifying them as idle time.
Maintain one written availability policy, as Trackunit recommends, that defines exactly what counts in the denominator for every metric. Store it alongside your KPI dashboard so a new analyst applies the same rules a veteran would, six months or six years from now.
Audit a sample monthly. Pull ten vehicles at random and manually verify their reported utilization against raw telematics logs and reservation records.
How Often Should You Review Fleet Utilization Metrics?
Review cadence should match how fast the underlying data changes and how costly a delayed decision is. Real-time alerts belong on idle-time and deadhead thresholds, since those problems compound daily if nobody notices.
Weekly reviews work best for the operational core: downtime percentage, utilization rate by vehicle, and PM compliance. Locus's research into root causes of low utilization specifically recommends a weekly KPI review rhythm because dispatch and maintenance problems get expensive fast when they go two or three weeks unaddressed.
Monthly reviews suit revenue per vehicle, cost per vehicle-day, and utilization variance across depots, metrics that are noisier week to week and clearer once seasonal or short-term swings smooth out.
Quarterly reviews are the right cadence for benchmarking against your own historical baseline and for fleet right-sizing decisions, since a single slow month shouldn't trigger a vehicle disposal, but three consecutive slow quarters should.
What Should You Do When You Spot Low Utilization?
The response depends entirely on which metric is flashing red and by how much.
If downtime percentage exceeds 15%, the intervention is maintenance-first: audit your PM schedule and spare-parts lead times before touching anything else, since Nomora's maintenance management guide covers how uptime gains compound into utilization gains elsewhere.
Adding vehicles to a fleet with a routing problem just adds more idle capacity.
If utilization variance across depots exceeds 15 to 20 percentage points between similar sites, the problem is usually process, not assets. Compare booking policies, staffing, and dispatch practices at the outlier location before assuming the vehicles themselves are the issue.
What Fleet Managers Get Wrong About Utilization
Most fleet managers chase a single utilization percentage as if it were a report card, and that instinct causes more bad decisions than it prevents. Set targets that protect maintenance windows, not just the number itself.
The metric most fleets underinvest in tracking is deadhead percentage, largely because it requires GPS and loaded/unloaded status, not just odometer readings. If you can only add one measurement capability this year, add that one.
Your first move in the next two weeks: pull 90 days of ignition and reservation data, calculate vehicle-level time utilization, and rank the fleet from lowest to highest.
Get Utilization Numbers You Can Trust With Nomora
Nomora connects reservation data, GPS tracking, and maintenance records so utilization metrics like downtime percentage, deadhead miles, and revenue per vehicle update automatically instead of living in three disconnected spreadsheets.
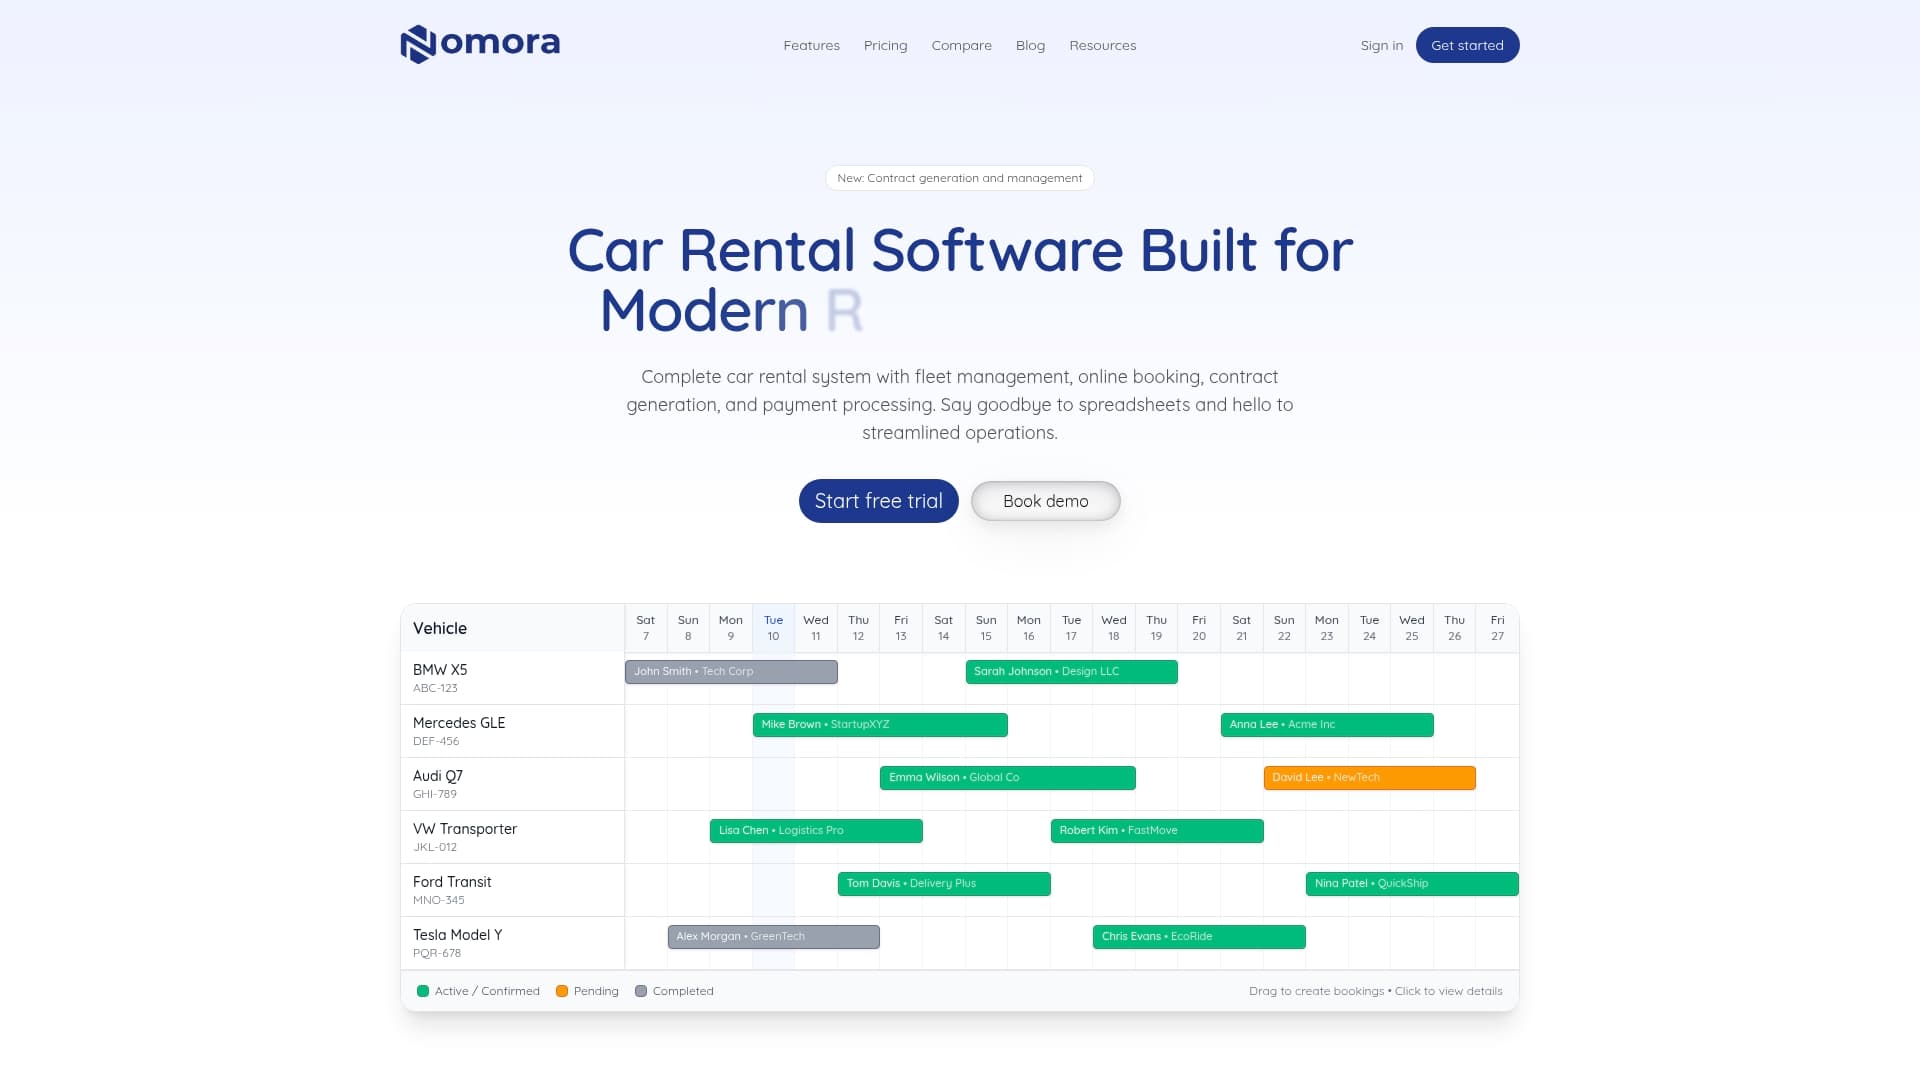
That connection matters because the metrics covered above are only useful if they're accurate and current. Nomora's reservation and fleet management platform ties booking data directly to utilization tracking, so a vehicle's active hours, idle time, and PM compliance show up on one dashboard instead of requiring a manual reconciliation every week. Onboarding runs 24 to 48 hours, so a pilot can be measuring real numbers within days, not months. If you manage a small independent fleet or a multi-depot rental network, check the use cases by business type and start a demo to see your own vehicles' utilization data connected end to end.
Sources
Recommended