The most useful examples of real-time reporting include sub-300ms fraud blocking, live campaign performance dashboards, checkout-abandonment watch lists, inventory stock-level alerts, fleet telematics panels, and patient-monitoring feeds. Each one solves the same core problem: shrinking the gap between an event happening and a person acting on it. That gap costs money. A fraud transaction not caught in milliseconds becomes a chargeback. A stockout not flagged for hours becomes a lost sale.
Platforms built for this, from streaming engines to purpose-built dashboards like Nomora, handle throughput that ranges from a handful of transactions to 40 to 90 million events processed daily at telecom scale. Here are the reports worth building first:
- Fraud block feed — flags and stops suspicious transactions before settlement, often in under 300 milliseconds.
- Live campaign dashboard — tracks spend, clicks, and conversion by channel as ad spend flows out the door.
- Checkout-abandonment watch — surfaces drop-off points in the funnel within seconds of a session ending.
- Inventory stock-level alerts — triggers reorder or price adjustment the moment stock crosses a threshold.
- Fleet telematics panel — shows vehicle location, health, and utilization as GPS pings arrive.
- Patient monitoring feed — pushes vital-sign anomalies to clinical staff immediately.
- Product-launch tracker — watches traffic, errors, and sentiment during the first hours of a release.
Key Takeaways
Real-time reporting works best when a team matches system speed to the actual cost of delay instead of chasing sub-second latency everywhere.
| Point | Details |
|---|
| Match latency to stakes | Reserve sub-300ms architecture for fraud and safety; use rolling windows for marketing and web analytics. |
| Start with cost of delay | Rank event sources by financial or operational loss per minute before building any pipeline. |
| Design for the "why" | Structure drilldowns so the first click reveals channel, product, or region, not just that a metric moved. |
| Test before automating | Run new alerts or blocking rules in shadow mode for several weeks before trusting them live. |
| Fleet reporting is a strong entry point | GPS and telematics feeds, like those in Nomora's fleet tracking, turn scattered vehicle data into one live view. |
Table of Contents
What Counts as Real-Time Reporting?
Real-time reporting is the continuous collection, processing, and display of data as events occur, with output delivered fast enough to change what a person does next. That last part is the test. A report that updates every 24 hours describes the past. A report that updates within seconds or minutes lets someone intervene while the outcome is still in motion.
Operationally, this usually means three things working together: a live data pipeline that never stops ingesting, a dashboard or alert system that refreshes without a manual pull, and a threshold or rule that tells someone (or something) when to act. Piwik PRO frames this well: real-time reporting is what lets a team adjust content, pause an underperforming ad, or handle a traffic spike while the event is still happening, not after a post-mortem.
Latency expectations vary sharply by use case, and this is where most teams overspend or underdeliver. Fraud prevention and safety-critical monitoring need sub-second response, often under 300 milliseconds. Operational routing (delivery dispatch, fleet rerouting) can tolerate 1 to 5 seconds. Web and marketing analytics are usually fine with a rolling window. Plausible's real-time analytics, for instance, show live traffic in a five-minute rolling window with dashboards refreshing every 30 seconds, which counts as "near real-time" rather than instantaneous, and that distinction matters when you're scoping a project. Chasing sub-second latency for a use case that only needs a five-minute window wastes engineering budget you'll want elsewhere.
What Are the Benefits of Real-Time Reporting?
The core benefits of real-time reporting are faster decisions, earlier anomaly detection, and tighter alignment between spend and results. Teams that adopt it stop reacting to yesterday's numbers and start adjusting today's operations while there's still time to change the outcome.
That shift shows up in a few concrete ways:
- Faster decisions — a pricing or inventory call gets made in minutes instead of waiting for the next batch report.
- Proactive incident response — an infrastructure or fleet issue gets flagged before it becomes an outage or a stranded vehicle.
- Improved campaign ROI — underperforming ads get paused mid-flight instead of after the budget is spent.
- Agile pricing and inventory adjustments — stock or rate changes happen the moment demand signals shift.
- Better personalization — next-best-offer logic reacts to what a customer just did, not what they did last week.
MongoDB's research on real-time analytics use cases groups these into a consistent pattern: personalization, application monitoring, fraud blocking, and production planning all depend on the same underlying capability, which is acting on an event within its window of relevance.
Pro Tip: Don't try to make every process real-time. Rank your workflows by "cost of delay," meaning what it actually costs you per minute or per hour of lag, and only build fast data paths for the ones near the top. A slow-moving report on monthly headcount doesn't need the same infrastructure as fraud detection.
Real-Time Dashboard Examples by Industry and Function
Every industry has a version of the same question: what changed in the last few minutes, and does someone need to know right now? The answer looks different depending on the function, but the report structure follows a repeatable shape: a clear purpose, a short list of metrics, a threshold that triggers an alert, and a latency target that matches the stakes.
Ecommerce: checkout-abandonment watch. This report tracks cart value, drop-off step, and device type as sessions end without completing. Watch cart abandonment rate by funnel step and time-to-abandon. A reasonable alert threshold is a spike of 15 to 20 percent above the rolling baseline within a 30-minute window. Latency expectations sit in the seconds-to-minutes range since the goal is a same-session recovery email or a same-day fix to a broken payment step.
Finance: fraud block feed. This is the highest-stakes report on the list. It scores transactions against velocity and behavioral rules and blocks or flags them before settlement. Core metrics are transaction velocity per account, geolocation mismatch, and score-threshold breaches. Advanced systems built on continuous stream processing can detect and block fraudulent transactions in under 300 milliseconds, which is only achievable because the system evaluates each event as it arrives instead of waiting for a batch job.
Marketing: live campaign dashboard. Spend, click-through rate, and conversion by channel, refreshed continuously so a team can pause a losing ad set before the budget disappears. Piwik PRO notes this is one of the clearest cases for real-time visibility, since teams can adjust content or stop underperforming ads while a campaign is still live rather than after the invoice arrives. A typical alert threshold is a cost-per-acquisition that exceeds target by 25 percent over any rolling hour.
Operations and infrastructure: incident monitor. Error rates, latency percentiles, and deployment health, watched continuously so an infrastructure issue gets caught within seconds, not during the next scheduled check. This is the report category behind most "why did the site go down" post-mortems that end with "we didn't see it happening."
Fleet and rental operations: telematics vehicle-health panel. GPS location, engine diagnostics, fuel or battery level, and utilization rate feed a live map view. A platform like Nomora structures this so a rental manager can catch a vehicle that's overdue for return or flagging a maintenance code, without walking the lot. This kind of real-time reservation and fleet tracking turns a fleet from a spreadsheet into something closer to a live map, and utilization dashboards built on the same data can also drive dynamic pricing triggers when demand shifts mid-day. Partner research on vehicle-tracking systems backs this up: continuous GPS and diagnostic feeds are what make proactive maintenance possible instead of reactive.

Healthcare: patient monitoring feed. Vital signs streamed continuously with anomaly thresholds tuned per patient. This is a textbook high-cost-of-delay scenario, alongside fraud detection and emergency response, where a few minutes of lag is the entire risk.
Telecom and IoT at scale: throughput-heavy operational analytics. A large telecom deployment processing 40 to 90 million business events daily shows what real-time reporting looks like once volume, not just speed, becomes the constraint. At that scale, the architecture decision matters as much as the alert logic.
Across every one of these, the report only earns its place on a dashboard if the first drilldown answers "why." A metric that moved without a channel, region, or product breakdown attached just creates more questions. Structure your first click to open the dimension your team argues about most, whether that's channel for marketing or vehicle ID for fleet operations.
How Do You Implement Real-Time Reporting Without Overbuilding?
Start by mapping events to metrics to alert recipients before writing a line of streaming code. This single step prevents the most common failure mode: building a fast pipeline for data nobody urgently needs.
- Identify event sources. List every system generating data worth watching, transactions, GPS pings, page views, sensor readings, and rank them by cost of delay.
- Pick an ingestion pattern. Decide between direct streaming and micro-batch based on how fast action actually needs to happen. Not every source needs sub-second treatment.
- Set retention windows. Define how long raw event data stays queryable versus when it rolls into aggregates. A five-minute rolling window, similar to what Plausible uses for web traffic, works for many operational dashboards.
- Define alerting and escalation. Assign a threshold, an owner, and a channel for every alert before it goes live, not after the first false alarm.
- Test with replay traffic. Run historical data through the pipeline in shadow mode to catch noisy thresholds before they hit a live team.
Pro Tip: Resist the urge to make every data path fast. Reserve true streaming architecture for the handful of processes where delay has a real dollar or safety cost, and let everything else run on a scheduled batch or a five-minute refresh.
Watch for three recurring pitfalls: alert fatigue from thresholds set too tight, noisy signals from sources that weren't cleaned before ingestion, and dashboards that show a number moved without showing which segment moved it. Each one erodes trust in the system faster than any latency problem does.
Choose streaming architecture for sub-second operational actions like fraud blocking, and micro-batch for near-real-time needs like hourly sales summaries where a short delay costs nothing. That single decision shapes almost every tool choice downstream.
A typical real-time stack has five layers, and most of the names you'll encounter map to one of them:
- Event sources — transactional databases, mobile apps, GPS units, and sensors that generate the raw stream.
- Message broker — Apache Kafka and Amazon Kinesis both queue and distribute high-volume event streams so downstream systems can consume them without overwhelming any single service.
- Stream processing — Apache Spark (specifically Spark Streaming) transforms, aggregates, and joins events in motion, turning raw messages into metrics.
- Analytics and visualization layers — platforms like Piwik PRO package streaming web and app data into live dashboards without requiring a custom pipeline.
- Front-end rendering — libraries like ApexCharts render the final live chart, typically through a WebSocket connection that appends new data points as they arrive.
That front-end pattern deserves a specific mention because it's where a lot of "real-time" dashboards quietly break. The reliable approach is WebSocket to appendData with a fixed x-axis range, trimming old points periodically so the chart doesn't visually warp or leak memory during a long session. Buffering messages and batching appends matters most on high-rate feeds, where every incoming event triggering a redraw will choke a browser tab within minutes.
One underused shortcut: many teams assume real-time reporting requires a full ETL pipeline, but modern tools can query operational databases or stream events directly, cutting both latency and the number of moving parts that can break.
What Do Real-World Latency and Throughput Numbers Tell You?
The evidence splits cleanly into two categories: speed-critical use cases measured in milliseconds, and volume-critical use cases measured in events per day. Knowing which category your project falls into determines almost everything about the build.
On the speed side, fraud-prevention systems built on continuous stream processing can block a fraudulent transaction in under 300 milliseconds, fast enough to stop settlement before it happens. On the volume side, a large telecom operator processes 40 to 90 million events daily to keep operational analytics current, a scale where the bottleneck shifts from "how fast" to "how much."
Web analytics sits in a third, more forgiving category: a five-minute rolling window with 30-second dashboard refreshes satisfies most marketing and content teams without any of the infrastructure fraud detection demands.
The decision rule of thumb: build real-time infrastructure when the financial or operational loss per minute of delay exceeds the ongoing cost of running that infrastructure. Fraud and patient safety clear that bar easily. A weekly inventory summary usually doesn't.
Pro Tip: Before flipping any new signal into a blocking or automated action, run it in shadow mode first. Log what the system would have done without letting it act, then compare against outcomes for a few weeks before trusting it live.
The right platform check comes down to eight questions: latency, connectors, stateful processing, alerting, scale, security, cost model, and embedded analytics. Get clear answers on these before signing anything.
When evaluating vendors, ask directly:
- What latency does the platform guarantee under contract, and how is it tested?
- Which connectors are supported natively, Kafka, Kinesis, REST APIs, or database change-data-capture?
- Can the platform join data from multiple sources in real time, not just display one feed at a time?
- How are alerts routed, and can escalation rules be customized per team?
- What does a proof-of-concept scope look like, and how long does it take to see live data?
- What security certifications and GDPR compliance does the platform carry?
- Is pricing based on data volume, seat count, or a flat tier, and how does that scale with growth?
- Does the platform include embedded dashboards, or does it require a separate visualization tool?
Copy this into your evaluation checklist:
How Does Real-Time Reporting Change Decision-Making?
Real-time reporting shifts organizations from a scheduled decision cadence to a continuous one. Once a team gets used to seeing a metric move within minutes, waiting for a weekly report starts to feel like flying with the instruments turned off.
That shift changes behavior in a specific, often underestimated way. Real-time reporting acts as the bridge between raw operational events and business decisions, moving teams from post-mortem analysis toward proactive tuning while an event is still unfolding. A marketing manager who once reviewed campaign performance every Monday morning starts checking it hourly during a launch, because the tool now rewards that behavior with information worth acting on.
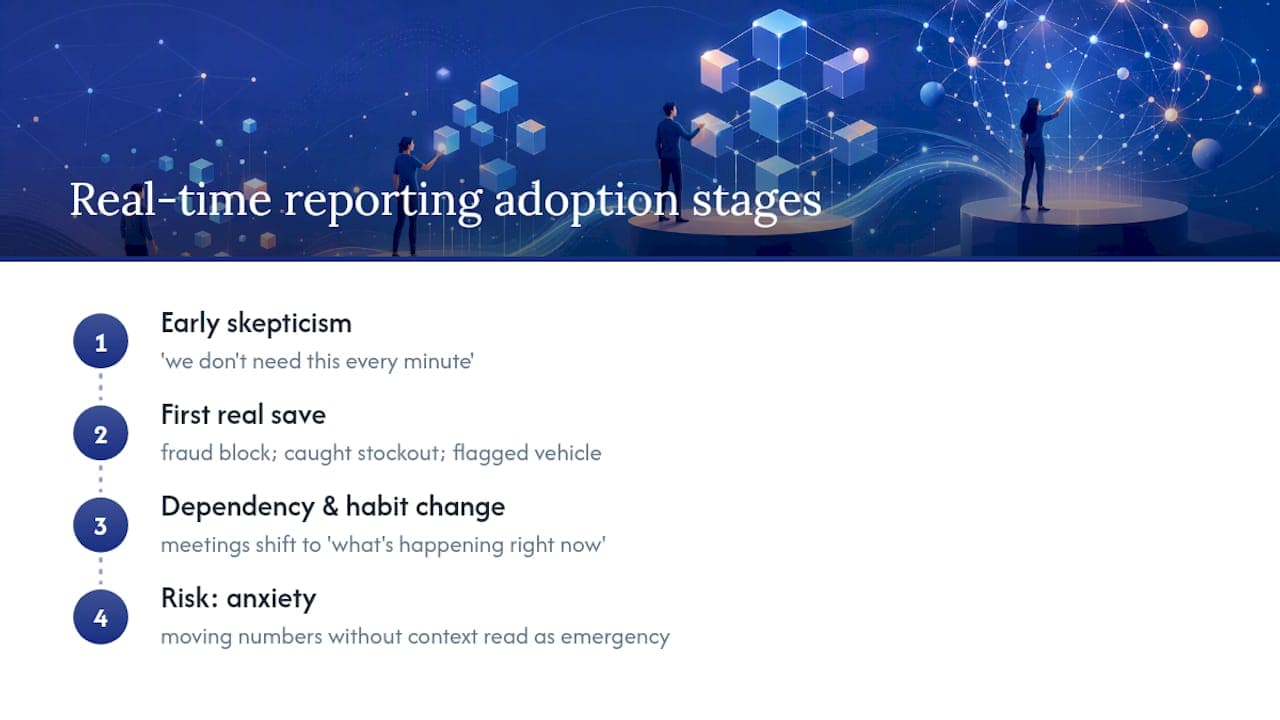
Adoption tends to follow a predictable curve. Early skepticism ("we don't need this every minute") gives way to dependency once one real save happens, a fraud block, a caught stockout, a fleet vehicle flagged before a breakdown. After that, the organizational habit changes: meetings shift from "what happened last week" to "what's happening right now," and reporting cadence stops being a calendar event and becomes a constant background process. The risk on the other side is real too: teams that roll out real-time dashboards without training people on what to ignore end up with more anxiety, not more clarity, because a moving number without context reads as an emergency even when it isn't one.
A candid take on real-time reporting trade-offs
Real-time reporting solves a genuine problem, but it introduces a new one: cognitive load, since a dashboard that updates every second demands attention every second whether or not anything meaningful happened. Nomora-style platforms earn their place specifically in operational and fleet contexts, where a vehicle's status or a booking conflict is exactly the kind of event that deserves that level of attention.
Frequently Asked Questions
What are some simple examples of real-time data?
GPS coordinates from a delivery van, a stock price tick, a credit card swipe, and a website visitor counter are all real-time data. Each one is only useful within a narrow window after it's generated.
What does real-time reporting mean in practice?
It means a report reflects events as they happen, not on a fixed daily or weekly schedule, and it's built to trigger action, not just record history.
What are common types of real-time reports?
The most common types are fraud and anomaly alerts, live campaign or sales dashboards, inventory and stock-level trackers, infrastructure health monitors, and telematics or fleet-status panels.
Is real-time reporting the same as near real-time?
No. True real-time typically means sub-second to a few seconds of delay. Near real-time, like a five-minute rolling window with a 30-second refresh, is close enough for most marketing and web-traffic use cases without the infrastructure cost of true streaming.
Do small businesses need real-time reporting?
Only for the specific processes where a delay actually costs money or creates risk. A small rental fleet benefits from real-time vehicle tracking; it rarely needs real-time reporting on quarterly revenue.
Sources
Recommended