Fleet cost reduction relies on data-driven strategies across fuel management, maintenance, driver behavior, and asset utilization. Combining telematics with route optimization and maintenance analysis delivers measurable savings and operational efficiency. Consistent, monthly review cycles and integrated data platforms are key to sustained fleet cost control and improvement.
Cost-saving strategies for fleet managers are discrete, actionable methods that reduce operating expenses across fuel, maintenance, driver behavior, and asset utilization. Fuel alone accounts for 30–40% of total fleet operating costs, making it the single largest controllable expense category. Insurance premiums are rising up to 30% in 2026, and diesel prices are projected at $5.35 per gallon. For small to medium fleets, uncontrolled costs in any one category can erase margins across the entire operation. The good news is that structured, data-driven fleet management cost reduction produces measurable results without requiring a large team or enterprise budget.
How to optimize fuel management to reduce costs
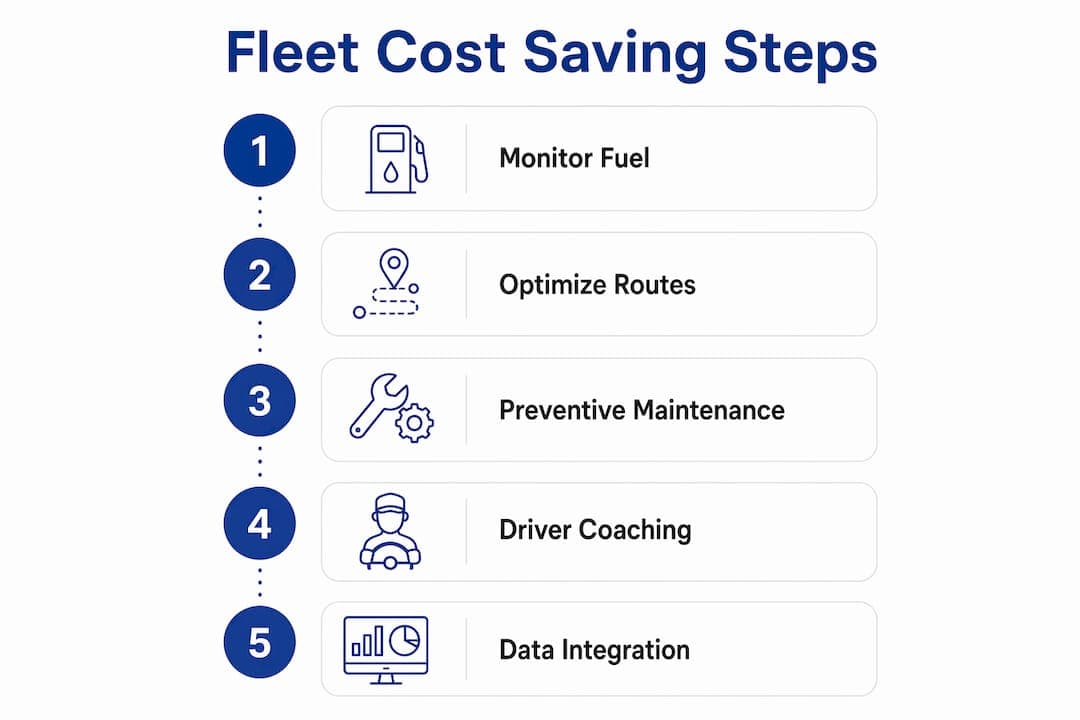
Fuel is where most fleet managers can find the fastest wins. The key is moving from passive tracking to active control across three areas: consumption monitoring, route planning, and driver behavior.
Monitoring and fraud prevention
Fuel card controls and telematics give you real-time visibility into fuel purchases, consumption rates, and fill patterns. This combination catches fuel fraud early, flags unusual transactions, and gives you a baseline to measure improvement. Without that baseline, you are managing by assumption rather than data.
Route optimization
Manual route planning wastes 2–4 hours daily, while AI-powered route optimization reduces that to minutes and increases stops per driver by 2–3 without adding headcount. That efficiency gain directly cuts fuel spend by reducing dead mileage and idle time. Idling wastes approximately one gallon of diesel per hour, which adds up to thousands of dollars monthly for heavy-duty fleets.
Fuel price forecasting
Build a fuel budget based on projected price ranges, not last year's actuals. With diesel projected at $5.35 per gallon in 2026, flat percentage increases from prior years will underestimate costs. Use forward price data and lock in fuel card rates where possible to reduce exposure to price spikes.
Set telematics alerts for excessive idle time above five minutes
Use fuel card controls to restrict purchase types and locations
Run weekly fuel consumption reports by driver and vehicle
Apply AI route tools to reduce empty miles on recurring routes
Review fuel budget monthly against actual pump data
Pro Tip:Set a hard idle-time threshold in your telematics system and tie it directly to driver performance reviews. Drivers who see idle time tracked are measurably more likely to shut off the engine.
Implementing preventive and predictive maintenance for cost control
Reactive maintenance costs 3–5 times more than preventive maintenance due to emergency parts sourcing, overtime labor, and unplanned downtime. That cost gap is the core argument for shifting your maintenance model before a breakdown forces your hand.
Building a data-driven maintenance budget
The industry benchmark for an effective maintenance program targets a 70/30 split between planned and reactive repairs, compared to the typical 50/50 split most fleets operate at. Reaching 70/30 requires tracking every repair by type, vehicle, and cause. That data lets you separate structural cost drivers from one-off incidents.
Audit current repair history by vehicle to identify repeat failures and high-cost outliers.
Separate planned from emergency repairs in your budget so you can track each category independently.
Set service intervals by mileage and engine hours, not calendar dates, for more accurate scheduling.
Negotiate parts pricing with two or three preferred vendors to reduce per-unit costs on high-volume items.
Review budget variance monthly. Variances within ±10% are manageable; anything above 15% signals a structural issue that needs investigation.
Maintenance type
Cost impact
Recommended share of budget
Preventive (scheduled)
Lowest per repair
70%
Predictive (data-triggered)
Low, avoids failures
Included in preventive
Reactive (emergency)
3–5x preventive cost
30% or less
Predictive maintenance and connected data
Connected fleet data enables predictive maintenance by triggering service alerts before a component fails. Fleets of approximately 100 vehicles using connected data for predictive maintenance report over $150,000 in annual maintenance savings. That figure reflects fewer emergency repairs, less downtime, and better parts planning.
Pro Tip:Link your telematics fault codes directly to your maintenance scheduling system. When a diagnostic trouble code fires, the system should automatically generate a work order, not wait for a driver to report a problem.
How does driver behavior affect fleet operating costs?
Aggressive driving behaviors increase fuel consumption, accelerate brake and tire wear, and raise accident risk, costing thousands per driver annually across a fleet. The connection between driver habits and total operating cost is direct and measurable. Telematics data makes that connection visible.
Effective driver behavior programs use three components working together:
Telematics scoring: Assign each driver a weekly score based on hard braking, rapid acceleration, speeding, and cornering. Scores create accountability without requiring a manager to ride along.
Coaching sessions: Use telematics event data to run short, specific coaching conversations. Generic safety talks produce little change. Showing a driver their own data produces faster results.
Incentive programs: Tie fuel bonuses or recognition to top-performing drivers each quarter. Positive reinforcement sustains behavior change longer than penalties alone.
Accident reduction: Safer driving lowers accident frequency. Fewer at-fault incidents directly reduce insurance claims and, over time, lower your premium renewal rates.
Integration with cost reporting: Feed driver scores into your monthly cost-per-mile reports. This connects individual behavior to fleet-wide financial outcomes and makes the business case for continued investment in coaching.
You can learn more about telematics for fleet managers and how to structure a data-driven driver program for your operation.
How does asset utilization affect fleet costs?
Underutilized vehicles carry full fixed costs: depreciation, insurance, registration, and scheduled maintenance. Fleet analytics reveal opportunities to reduce fleet size by 10–15% without reducing operational capacity. That reduction translates directly into lower fixed costs across every expense category.
Steps to right-size your fleet
Pull utilization reports for every vehicle over a 90-day period. Flag any vehicle below 60% utilization as a candidate for redeployment or disposal.
Analyze demand patterns by route, season, and business unit to understand whether low utilization is structural or temporary.
Redeploy underused vehicles to higher-demand areas before purchasing or leasing additional units.
Sell or return surplus vehicles that consistently underperform. The fixed cost savings from removing one vehicle often exceed the revenue from keeping it marginally active.
Review fleet size quarterly against demand forecasts to stay ahead of capacity mismatches.
Utilization level
Recommended action
Cost impact
Above 85%
Maintain; monitor for capacity gaps
Optimal fixed cost recovery
60–85%
Review scheduling; consider redeployment
Moderate inefficiency
Below 60%
Redeploy or dispose
High fixed cost waste
For a deeper look at fleet utilization best practices, Nomora's resource library covers how to apply these thresholds across different fleet types.
How does data integration reduce fleet operating expenses?
Fragmented data is one of the most expensive problems in fleet management. When fuel data, maintenance records, driver scores, and vehicle location live in separate systems, you lose the ability to connect cause and effect. A unified platform links those data streams and makes automated decisions possible.
The practical benefits of integrated fleet data include:
Automated maintenance triggers: Engine fault codes from telematics automatically generate service work orders, cutting the lag between a detected issue and a scheduled repair.
Fraud detection: Cross-referencing fuel card transactions with GPS location data flags purchases that do not match vehicle position, catching fraud in real time.
Budget forecasting: Unified cost data by vehicle, driver, and route feeds directly into monthly budget reports, replacing manual spreadsheet work.
Real-time alerts: Managers receive instant notifications for speeding, geofence violations, and abnormal fuel consumption, enabling same-day intervention.
Cost-per-mile reporting: Combining fuel, maintenance, and labor data into a single cost-per-mile figure gives you the clearest measure of fleet efficiency over time.
Advanced telematics integration is the defining capability separating high-performing fleets in 2026 from those still reacting to problems after they occur. The real-time data benefits for fleet decision-making compound over time as your historical dataset grows and your predictive models improve.
Data source
Integrated benefit
Cost category affected
Telematics
Predictive maintenance triggers
Maintenance, downtime
Fuel cards
Fraud detection, consumption tracking
Fuel
Driver scoring
Behavior coaching, insurance claims
Fuel, insurance
GPS location
Route validation, idle monitoring
Fuel, labor
The 42-Point Car Rental Operations Checklist
The exact checks profitable rental operators run every week — free, straight to your inbox.
Fleet readiness & handover
Bookings & no-show prevention
Pricing & revenue reviews
Contracts & compliance
Payments & invoicing
Maintenance & fleet health
One email with the checklist. No spam, unsubscribe anytime.
Key Takeaways
The most effective fleet management cost reduction combines fuel control, preventive maintenance, driver behavior coaching, and utilization analysis into a single, data-driven review cycle.
Point
Details
Fuel is the top target
Fuel accounts for 30–40% of fleet costs; telematics and route tools cut it fastest.
Preventive beats reactive
Planned maintenance costs 3–5x less than emergency repairs; target a 70/30 split.
Driver behavior drives savings
Telematics scoring and coaching reduce fuel waste, wear, and accident-related costs.
Right-size before you buy
Analytics can reveal a 10–15% fleet reduction opportunity without losing capacity.
Unified data multiplies results
Integrated platforms connect fuel, maintenance, and driver data for automated cost control.
What I've learned about fleet cost control that most guides skip
Fleet cost control is described as a project. In practice, it is a discipline. The fleets that sustain savings year over year are not the ones that ran a big efficiency initiative. They are the ones that built monthly review cycles into their operations and stuck with them.
The metric I keep coming back to is Cost Per Mile (CPM). It is the one number that ties fuel, maintenance, driver behavior, and utilization together into a single, honest measure of how efficiently your fleet operates. If your CPM is trending up, something is wrong somewhere. If it is trending down, your programs are working. Everything else is a supporting detail.
The other thing most guides understate is the compounding effect of connected data. When your telematics, maintenance records, and fuel data all feed into one system, you stop managing by exception and start managing by pattern. That shift is where the real savings live. A single alert about an idling driver is useful. A 90-day pattern showing that three drivers on the same route idle 40% more than average is a structural problem worth fixing.
My honest recommendation: start with fuel and maintenance, get those two data streams unified, and build from there. Trying to fix everything at once produces reports nobody reads and changes nobody makes.
— Dizzy
How Nomora supports fleet cost control
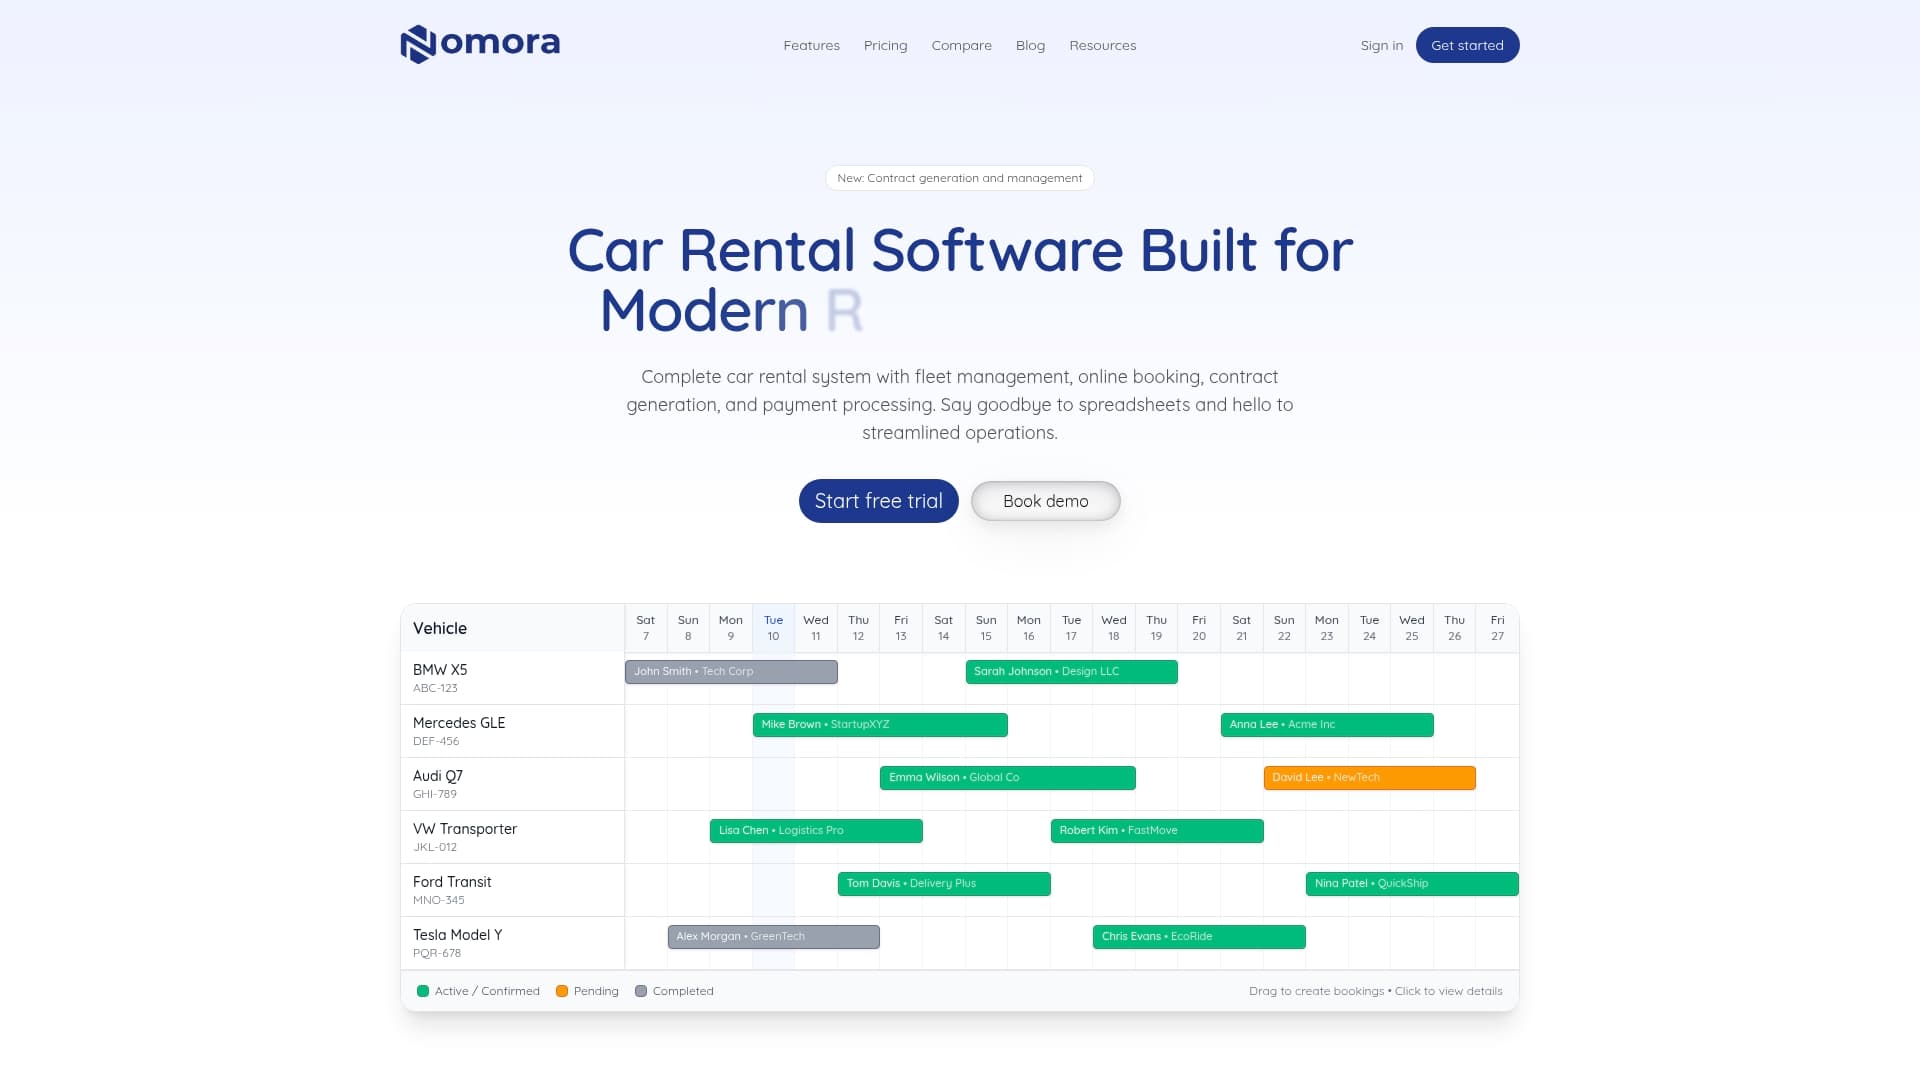
Nomora's cloud-based fleet management platform acts as the central nervous system for your operation, connecting reservations, vehicle data, maintenance scheduling, and payment processing in one place. Fleet managers using Nomora gain real-time visibility into vehicle status, cost tracking by asset, and automated alerts that replace manual follow-up. The platform's fleet management software handles everything from contract generation to GPS integration, reducing the administrative overhead that pulls managers away from cost control work. For businesses ready to see how Nomora fits their specific operation, the use cases page breaks down benefits by business type and fleet size.
FAQ
What is the biggest cost-saving opportunity for fleet managers?
Fuel is the largest controllable expense, representing 30–40% of total fleet operating costs. Combining telematics monitoring with route optimization and driver coaching produces the fastest measurable reduction.
How much can preventive maintenance save compared to reactive repairs?
Reactive maintenance costs 3–5 times more than planned maintenance. Shifting your maintenance ratio from 50/50 to 70/30 planned versus reactive significantly lowers total repair spend and reduces vehicle downtime.
How does driver behavior affect fleet costs?
Aggressive driving increases fuel consumption, accelerates component wear, and raises accident risk. Telematics-based coaching programs address these behaviors directly and, over time, lower insurance premiums through fewer at-fault claims.
What utilization rate signals an underused fleet vehicle?
Vehicles running below 60% utilization over a 90-day period are strong candidates for redeployment or disposal. Fleet analytics can reveal a 10–15% reduction in fleet size without reducing operational capacity.
How often should fleet managers review their cost budgets?
Monthly budget reviews are the standard for effective fleet cost control. Variances within ±10% are manageable, but anything above 15% warrants investigation to determine whether the cause is structural or temporary.