Real-time data visibility enables fleet managers to make informed decisions, reducing costs and improving operational efficiency. It transforms reactive management into proactive control by providing instant insights into vehicle status, driver behavior, and maintenance needs. Implementing integrated, live dashboards significantly enhances fleet utilization, safety, and customer satisfaction while closing critical visibility gaps.
Data visibility is defined as the ability to access real-time, comprehensive information about fleet vehicles, driver behavior, and operational status, giving fleet managers the control they need to make decisions based on facts rather than assumptions. For rental fleet managers specifically, this capability is the difference between a profitable operation and one hemorrhaging money through avoidable inefficiencies. Operating without real-time data visibility can cost $760 per day per vehicle in downtime alone, with fuel budget waste running an additional 15 to 25%. Understanding why data visibility matters for fleet managers starts with recognizing that the problem is rarely a shortage of data. It is a shortage of timely, usable insight.
Why data visibility matters for fleet managers
Fleet management data insights translate directly into operational and financial outcomes. The benefits are not abstract. They show up in your fuel bills, your maintenance schedule, your accident reports, and your customer satisfaction scores.
Here is what improved data visibility delivers in practice:
Fleet utilization gains of 15 to 25%.Transitioning to AI-driven visibility lifts utilization by 15 to 25% and cuts accident costs by 35%. For a rental company running 50 vehicles, a 20% utilization improvement means 10 additional revenue-generating vehicles without adding a single unit to the fleet.
Predictive maintenance that prevents breakdowns. Real-time diagnostics detect failures 20 to 45 days before they occur, with an 89% accuracy rate and a 52% reduction in unplanned downtime. A vehicle that does not break down on a customer's rental is a vehicle that does not generate a claim, a complaint, or a recovery cost.
Fuel cost control. When you can see driver behavior in real time, including idling, hard acceleration, and route deviations, you can correct it before it compounds. Fuel waste in the 15 to 25% range is not a fixed cost. It is a recoverable one.
Customer experience improvements. Accurate ETAs, proactive communication about vehicle status, and faster response to breakdowns all depend on live operational data. Customers who receive accurate information are less likely to escalate complaints and more likely to rebook.
Pro Tip:Do not measure the value of data visibility only in cost savings. Track how many customer-facing incidents your team resolves proactively versus reactively. That ratio tells you more about operational maturity than any single KPI.
The benefits of data transparency compound over time. A team that consistently acts on live data builds faster reflexes, better judgment, and a culture of accountability that spreadsheets and end-of-day reports simply cannot produce.
How does real-time data visibility overcome traditional fleet challenges?
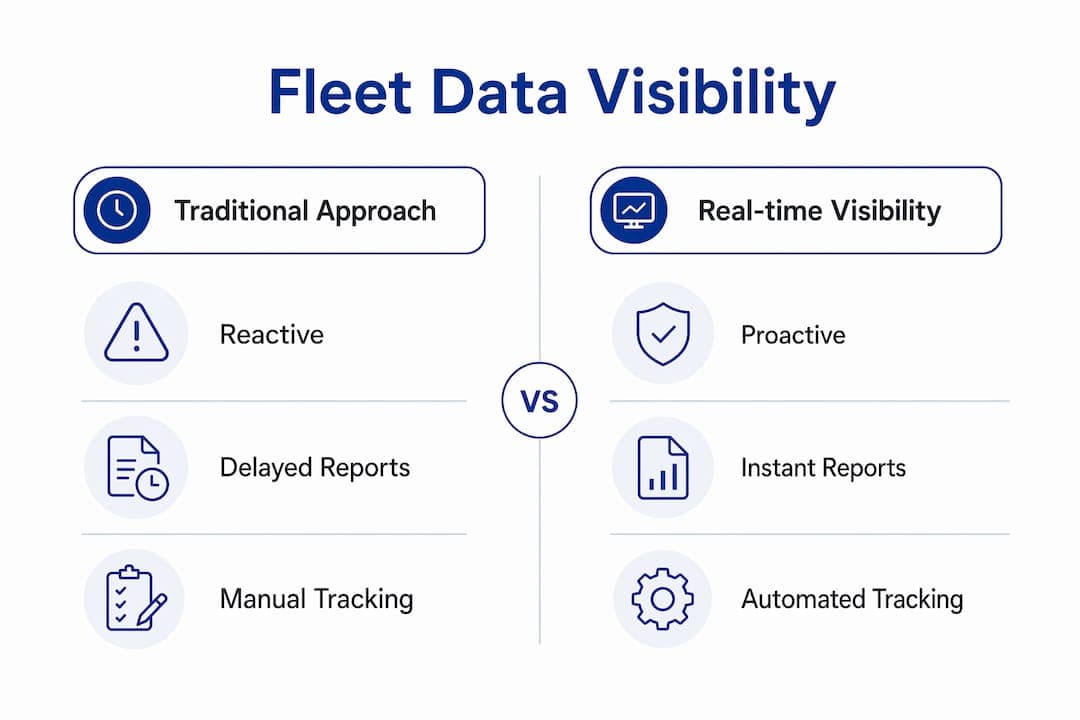
The traditional approach to fleet management is reactive by design. Reports arrive at the end of a shift. Maintenance issues surface after a breakdown. Fuel anomalies appear on a monthly invoice. By the time the data reaches the manager, the opportunity to intervene has already passed.
Operational visibility is now a core requirement for competitive fleet operations. Managers who once reviewed weekly summaries now intervene within minutes using live dashboards. This shift from daily reporting cycles to real-time intervention is not a technology upgrade. It is a fundamental change in how decisions get made.
Consider four specific ways real-time visibility closes the gaps that traditional management leaves open:
Eliminating the depot blind spot.Visibility drops sharply once vehicles leave the depot, creating unseen inefficiencies and risks. Real-time GPS and telematics data keep every vehicle on the map, regardless of location.
Replacing guesswork with confirmed status. When a customer calls to ask where their rental vehicle is, a manager with live tracking gives a precise answer in seconds. Without it, the answer is a guess dressed up as confidence.
Accelerating disruption response. Traffic incidents, mechanical warnings, and driver behavior alerts surface immediately. A manager who knows about a tire pressure warning before the driver does can reroute, schedule service, and notify the customer before the situation escalates.
Improving decision speed across the operation. Fleet managers move from hoping a plan works to controlling outcomes in real time, adapting to traffic, weather, and driver behavior as conditions change. That shift from reactive to proactive is where the real competitive advantage lives.
The contrast between old and new approaches is not subtle. Manual tracking and delayed reports are not just slower. They are structurally incapable of supporting the decision speed that modern rental operations require.
What challenges do fleet managers face in achieving data visibility?
Achieving genuine data visibility is harder than buying a telematics subscription. Most rental fleet managers already have more data than they can use. The problem, as research from HydrogenBI confirms, is timing and clarity, not volume. High-performing teams focus on early clarity and reacting to changes, not just collecting data.
The most common obstacles include:
Confusing data volume with data visibility. A dashboard showing 200 metrics is not visibility. It is noise. Visibility means the right signal reaches the right person at the right moment. Cutting your dashboard to the 10 metrics that drive decisions is more valuable than expanding it to 50.
Fragmented systems with no integration layer. Telematics data sits in one platform, maintenance records in another, and payment data in a third. Without a unifying integration layer, managers spend more time reconciling data than acting on it. Fleet intelligence platforms that integrate telematics, maintenance, and finance into a single audit-ready layer solve this without requiring a full data migration.
Data that is not retrieval-ready.Addressing visibility starts with auditing data touchpoints and ensuring data is properly tagged before investing in advanced analytics. Untagged, unstructured data is invisible data, regardless of how much of it you have.
Visibility limited to browser dashboards.Effective fleet visibility requires data to be accessible at the point of action, including physical displays in dispatch areas, not just screens in a manager's office. If your maintenance team cannot see the alert, the alert does not exist in any practical sense.
Pro Tip:Before investing in a new analytics platform, spend one week documenting every data touchpoint in your operation. Where does data enter the system? Where does it get stuck? That audit will tell you exactly where your visibility gaps are and which ones to fix first.
How can rental fleet managers implement effective data visibility?
Implementation is where good intentions meet operational reality. The following comparison shows the difference between a low-maturity and high-maturity approach to data visibility in rental fleet operations.
Practice
Low maturity
High maturity
Vehicle status tracking
End-of-day manual check-in
Live GPS and telematics with automated alerts
Maintenance scheduling
Mileage-based intervals
Predictive diagnostics detecting issues 20 to 45 days early
Fuel monitoring
Monthly invoice review
Real-time driver behavior flagging with per-trip reporting
Reporting cadence
Weekly or monthly summaries
Live dashboards with role-specific views for dispatch, maintenance, and management
Data integration
Separate systems with manual reconciliation
Unified platform connecting reservations, telematics, and payments
Moving from low to high maturity does not require replacing every system at once. The practical path forward follows four steps.
Start with a data-touchpoint audit. Map every point where data enters your operation, from reservation intake to vehicle return, and identify where information gets delayed, lost, or siloed. This audit is the foundation for every decision that follows.
Deploy real-time visibility tools with predictive analytics capabilities. Platforms that combine GPS tracking with AI-driven maintenance alerts give you both location awareness and forward-looking risk management. Live data dashboards deploy in an average of five days and generate $3.50 in savings for every $1 spent in early deployment. Even small rental fleets see measurable ROI quickly.
Train your team to act on live data rather than wait for reports. Technology without behavioral change produces dashboards that nobody checks. Build a daily rhythm around live data review, starting with dispatch and maintenance teams who have the most direct impact on vehicle availability.
Monitor data quality continuously. A visibility system is only as reliable as the data feeding it. Set up automated checks for GPS signal gaps, missing maintenance records, and booking conflicts. Fleet utilization reporting tied to live data gives you the operational KPIs needed to track improvement over time.
Key takeaways
Real-time data visibility is the single most impactful operational investment a rental fleet manager can make, directly reducing downtime costs, fuel waste, accident frequency, and customer complaints.
Point
Details
Downtime cost is quantifiable
Avoidable downtime costs $760 per vehicle per day without real-time visibility.
Utilization gains are significant
AI-driven visibility improves fleet utilization by 15 to 25% and cuts accident costs by 35%.
Data volume is not the problem
Most fleets have excess data but lack timely, clear signals. Focus on meaningful metrics.
Integration is the key enabler
Unifying telematics, maintenance, and payment data into one layer eliminates decision delays.
Implementation is faster than expected
Live dashboards deploy in an average of five days with ROI of $3.50 per $1 spent.
The 42-Point Car Rental Operations Checklist
The exact checks profitable rental operators run every week — free, straight to your inbox.
Fleet readiness & handover
Bookings & no-show prevention
Pricing & revenue reviews
Contracts & compliance
Payments & invoicing
Maintenance & fleet health
One email with the checklist. No spam, unsubscribe anytime.
The visibility gap nobody talks about
I have worked with fleet managers who could recite their monthly fuel spend to the dollar but had no idea which three vehicles in their fleet were responsible for 40% of it. That is not a data problem. It is a visibility problem, and it is far more common than the industry acknowledges.
The uncomfortable truth is that most rental fleet managers are managing by memory and habit rather than by data. They know their fleet intuitively, which is valuable, but intuition does not scale. When you add 10 vehicles, open a second location, or bring on a new driver cohort, intuition breaks down. Real-time visibility is what replaces it.
What I have seen consistently is that the managers who resist visibility tools are usually the ones who fear what the data will reveal. And what it reveals is almost always fixable. A vehicle sitting idle three days a week. A driver whose fuel consumption runs 30% above the fleet average. A maintenance backlog that is quietly compressing your available fleet by 15%. These are not catastrophic findings. They are opportunities.
Data visibility provides governance, audit trails, and strategic enablement, not just monitoring. The managers who understand this stop treating visibility as a reporting function and start treating it as the central nervous system of their operation. That shift in mindset is what separates fleets that grow from fleets that plateau.
The investment is smaller than most managers expect. The return is larger than most CFOs anticipate. And the competitive gap between fleets that have it and fleets that do not is widening every quarter.
— Dizzy
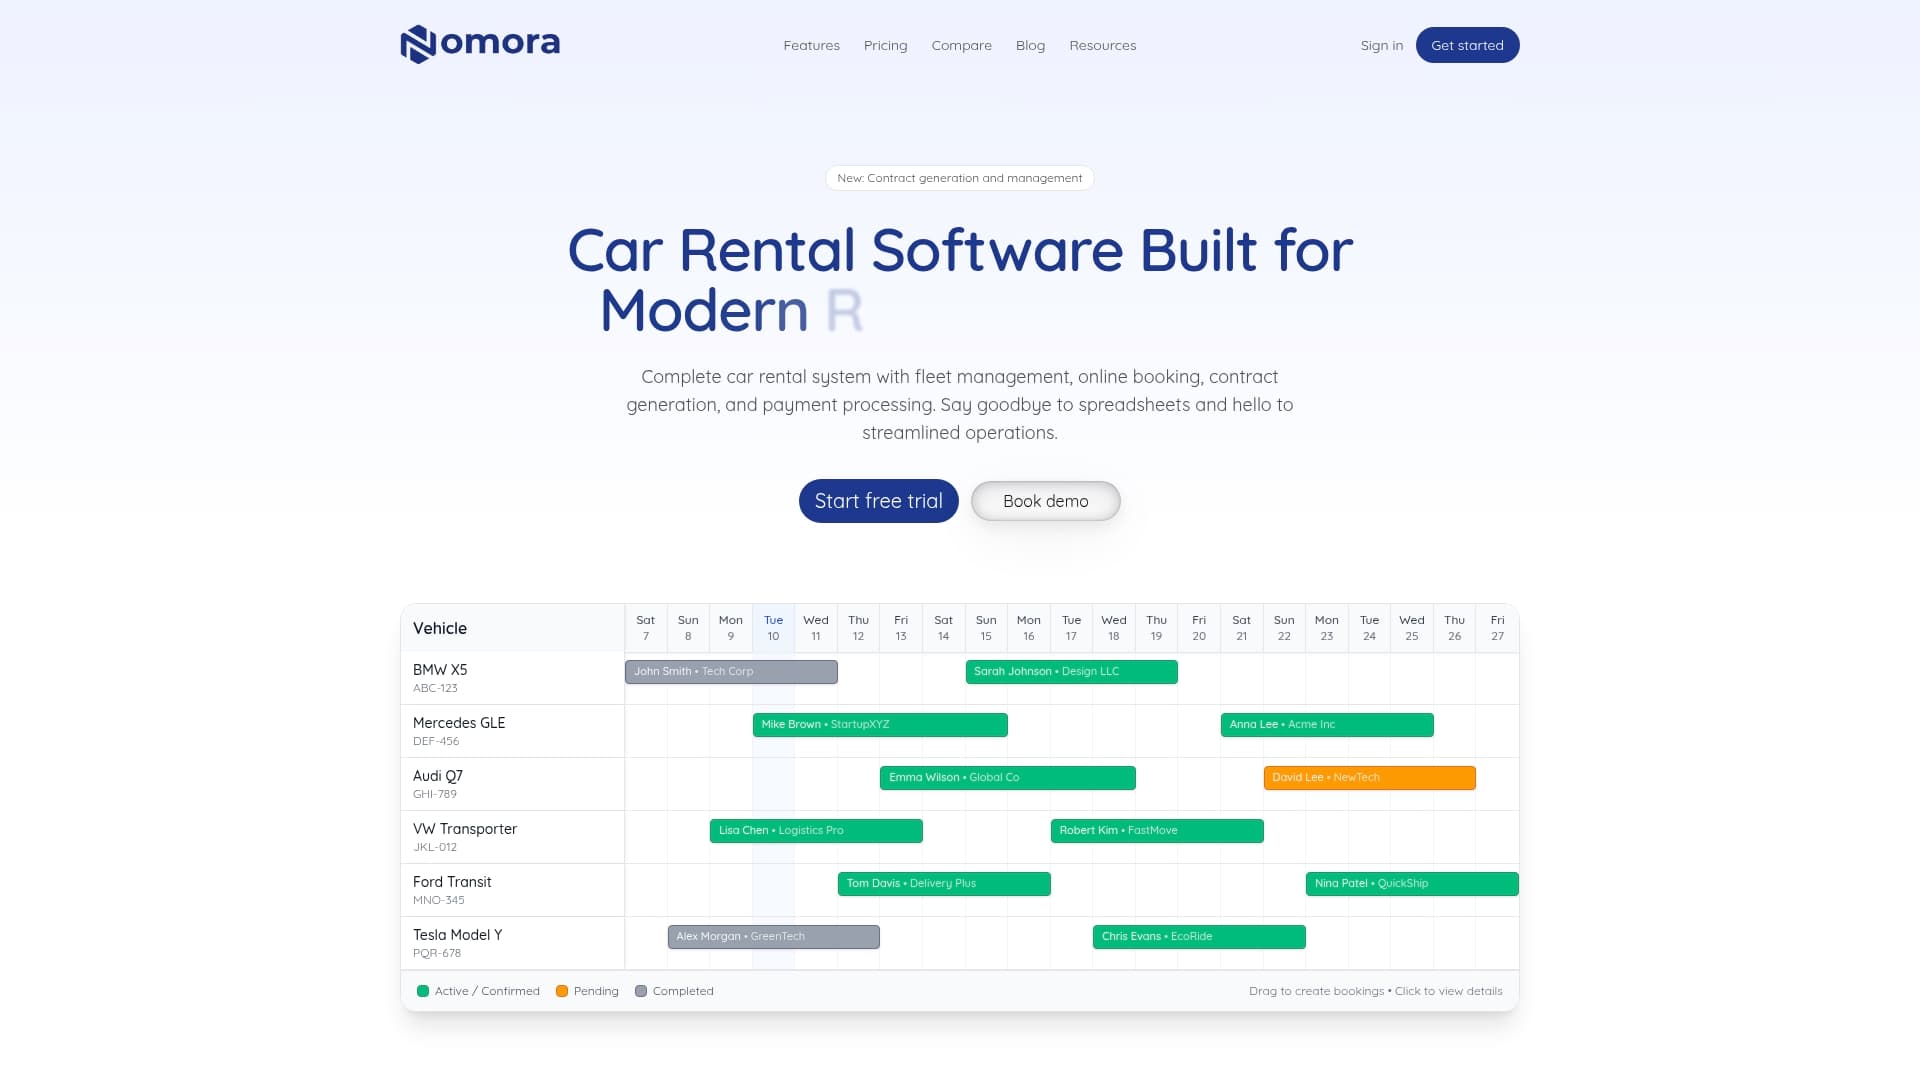
See how Nomora puts this into practice
Nomora is a cloud-based car rental management platform built specifically for rental operators who need real-time data visibility without the complexity of enterprise software. The platform unifies reservations, GPS tracking, maintenance records, and payment data into a single system, giving fleet managers the live operational picture they need to act quickly and accurately. Deployment takes 24 to 48 hours, and the integration with telematics providers means you are not starting from scratch. If you are ready to move from end-of-day reports to real-time control, explore Nomora's rental fleet solutions to see which configuration fits your operation.
FAQ
What is data visibility in fleet management?
Data visibility in fleet management is the ability to access real-time, accurate information about vehicle location, condition, driver behavior, and operational status through a unified platform. It enables fleet managers to make decisions based on current facts rather than delayed reports.
How does data visibility reduce fleet operating costs?
Real-time visibility reduces costs by detecting maintenance failures 20 to 45 days early, cutting unplanned downtime by 52%, and identifying fuel waste patterns that account for 15 to 25% of the average fleet fuel budget.
What is the difference between data volume and data visibility?
Data volume refers to how much information a fleet generates. Data visibility refers to whether the right information reaches the right person at the right time. Most fleets have excess data but lack the integration and timing needed to act on it.
How quickly can a rental fleet deploy a real-time visibility system?
Live data dashboards deploy in an average of five days, according to fleet technology research. Platforms like Nomora reduce setup time further, with full onboarding completed in 24 to 48 hours for most rental operators.
Does data visibility help with regulatory compliance?
Fleet intelligence platforms that integrate telematics and maintenance data provide audit-ready records and traceable data trails, which directly support compliance with safety regulations, insurance requirements, and driver accountability standards.