A fleet status dashboard is one screen that tells you, right now, which vehicles are rented, ready, in the shop or out of service, and why. For a rental or corporate fleet, the useful version shows a small set of live statuses, a handful of KPIs (utilization, downtime, maintenance compliance) and a clear path from "this car is unavailable" to "this car is back on the lot." This guide shows what to put on it, how to track downtime from start to finish, and how to review it so the numbers change decisions.
TL;DR
- A fleet dashboard is a centralized, live view of vehicles, drivers, costs and maintenance status. Unlike a static report, it shows what is happening now, not what happened last month (Superblocks).
- Start with vehicle status (available, reserved, on rent, in maintenance, out of service) and four KPIs: utilization, downtime, maintenance compliance and cost per vehicle.
- Track downtime as a timeline with a reason code at every step, so you can see where days are lost, not just that they were.
- Review exceptions daily, upcoming maintenance weekly, performance and cost monthly, and suppliers and replacement plans quarterly.
- Nomora brings reservations, fleet tracking and GPS into one cloud system, with onboarding designed to take 24 to 48 hours.
Table of Contents
What a fleet status dashboard actually is
Think of it as the central nervous system of your operation. Signals from bookings, maintenance, GPS and payments arrive in one place, and you see the whole fleet react at once instead of checking five tools.
A fleet management dashboard pulls data from sources such as telematics, fuel cards, maintenance logs and dispatch systems, then turns it into maps, charts and KPIs. Superblocks describes it as a live view rather than a historical report. That difference matters most for rental companies, where a vehicle's status can change several times a day: returned, inspected, cleaned, flagged for a warning light, rebooked.
A "status" dashboard is the operational slice of that idea. It answers four questions quickly:
- Which vehicles can I rent right now?
- Which are committed to upcoming reservations?
- Which are unavailable, and for what reason?
- When will each unavailable vehicle return to service?
Cost analysis, driver scoring and fuel trends are useful, but if the status view is unclear, they will not save you from double-booked cars and idle vehicles.
The vehicle statuses to show
Keep your status list short and mutually exclusive. Every vehicle should be in exactly one state at any moment. A practical set for rentals:
| Status | What it means | Why it matters |
|---|
| Available | Cleaned, inspected, ready to hand over | Your sellable inventory |
| Reserved | Assigned to a confirmed booking, not yet out | Prevents double-booking |
| On rent | With a customer | Revenue-producing days |
| Returned, pending turnaround | Back on the lot, not yet cleaned or inspected | Often a hidden source of lost hours |
| In maintenance | Scheduled or unscheduled service | Planned work should be booked around reservations |
| Out of service | Damage, repair, parts wait, or compliance hold | The main source of downtime |
Two things make this view trustworthy. First, status changes must happen at the point of work (check-in, inspection, work order) and not be typed in at the end of the day. Second, the dashboard should connect status to bookings, so a vehicle going into the shop immediately shows which reservations it affects. Conflict-free booking depends on that link.
Online or offline state is a useful extra if you use GPS or telematics. Hicron's dashboard design guide lists vehicle online/offline status, engine diagnostic codes and driver safety scores as health and security widgets, alongside fuel efficiency, idle time, on-time performance and asset utilization as performance widgets.
The KPIs worth putting next to the statuses
It is tempting to chart everything. One KPI guide suggests 12 to 15 KPIs across cost, operations, maintenance and safety, including vehicle utilization rate, vehicle downtime percentage, preventive maintenance compliance and the ratio of planned to unplanned maintenance. That is a good reference list for a large mixed fleet. For a small or mid-sized rental business, start with four and add more only when someone asks a question the dashboard cannot answer.
Utilization
Utilization is the share of time your vehicles are earning money. Show it per vehicle and per category (economy, SUV, luxury, vans), because an average hides the car that sits for three weeks. For a deeper look, see our guides on what fleet utilization is and why it matters and the key fleet utilization metrics.
Downtime
Downtime is the time a vehicle is unavailable when it could otherwise be rented. Show it as total days and as a percentage of fleet days in the period, split by reason. We cover how to record it step by step below.
Maintenance compliance
Track how many vehicles are overdue for scheduled service and how many services were completed on time. Preventive work is easier to schedule around bookings than a breakdown is. Our 30/60/90 day preventive maintenance plan and maintenance scheduling workflow show how to build that routine.
Cost per vehicle
Add maintenance and repair cost per vehicle, so you can spot units that cost more to keep than they earn. Our piece on cost-saving strategies for fleet managers goes deeper.
Corporate fleet managers can swap rental-specific measures for their own: assignment rate, vehicles awaiting replacement, and inspection or registration deadlines.
How to track vehicle downtime from start to finish
Most rental companies know a car was "in the shop." Fewer know how many of those days were spent waiting: for a technician, for a part, for an estimate approval, for a clean. Recording downtime as a timeline makes those gaps visible.
Step 1: Timestamp the moment a vehicle becomes unavailable
When a car is pulled from rentable inventory, log the date and time, the vehicle, who flagged it, and a reason code. Use a short, fixed list so the data can be grouped later:
- Scheduled preventive maintenance
- Unscheduled mechanical repair
- Accident or damage repair
- Waiting for parts
- Waiting for approval or insurance
- Cleaning or detailing
- Compliance hold (inspection, registration, recall)
- Special project (for example, a rebrand or equipment install)
Step 2: Check the reservations the vehicle affects
The moment a vehicle goes out of service, the system should show every booking in the affected window so you can swap in a comparable vehicle. This is where an integrated booking and fleet system pays off: a spreadsheet will not warn you that Friday's pickup now has no car.
Step 3: Record each handoff
Downtime often has stages: diagnosis, waiting for parts, repair, quality check, cleaning. Log each change of stage with a timestamp. You will find that the repair itself may be a day, while the wait is a week.
Step 4: Set an expected return date and update it
Every out-of-service vehicle should show an expected return-to-service date. When it slips, update it and note why. Overdue return dates should be the first thing your dashboard highlights.
Step 5: Close the loop with a return-to-service check
A vehicle is not "back" until it is inspected, cleaned and flagged available. Closing the record with a timestamp gives you the total downtime for the event and lets you compare it with your target.
A worked example
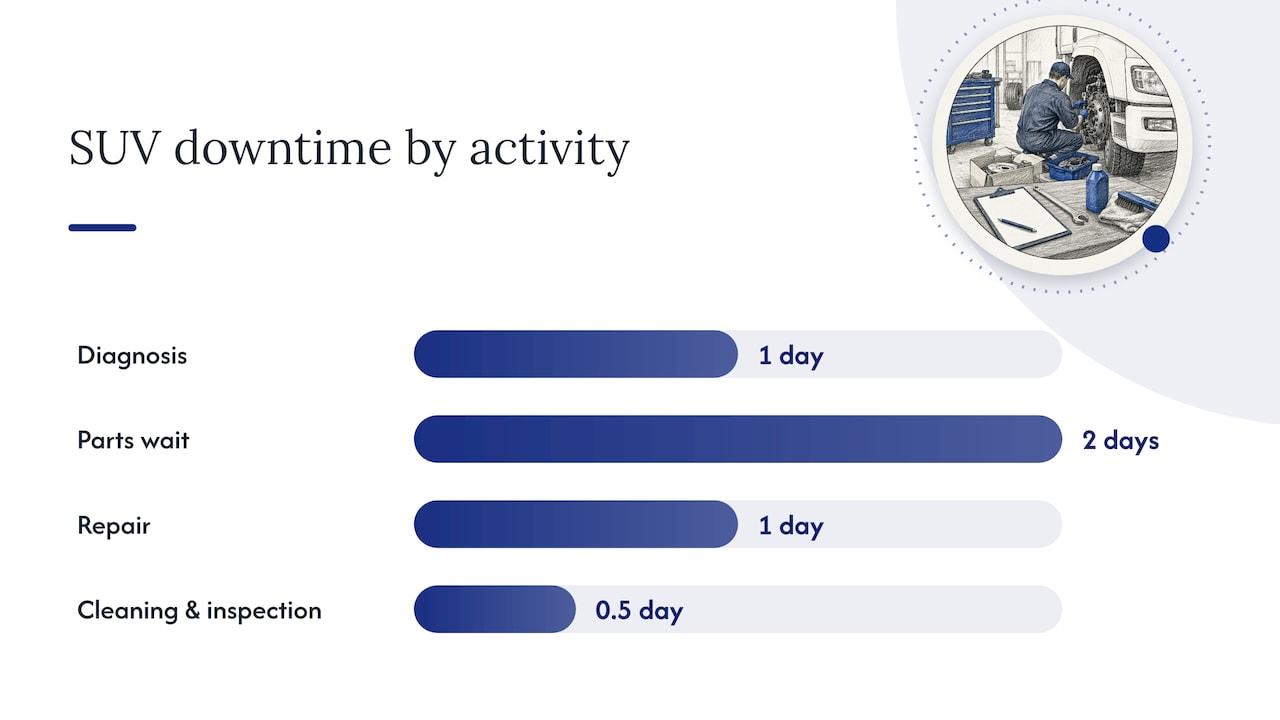
Suppose an SUV is flagged on Monday morning for a brake warning. It waits one day for a diagnosis, two days for a part, one day for the repair and half a day for cleaning and inspection. That is four and a half days of downtime, and only one of them was actual repair work. The dashboard would show the biggest block is the part wait. The fix is not a faster mechanic. It could be a standing arrangement with a parts supplier, or a decision to buy locally at a higher price.
That last point is not hypothetical. According to FleetOwner's report on how Estes Express uses maintenance KPIs, the carrier tracks vehicles waiting for parts, and it recognizes that when uptime is valuable, a locally bought part at a higher price can be worth the extra expense.
Turning downtime data into fewer lost days
A dashboard is only worth the decisions it prompts. Three habits turn downtime data into action.
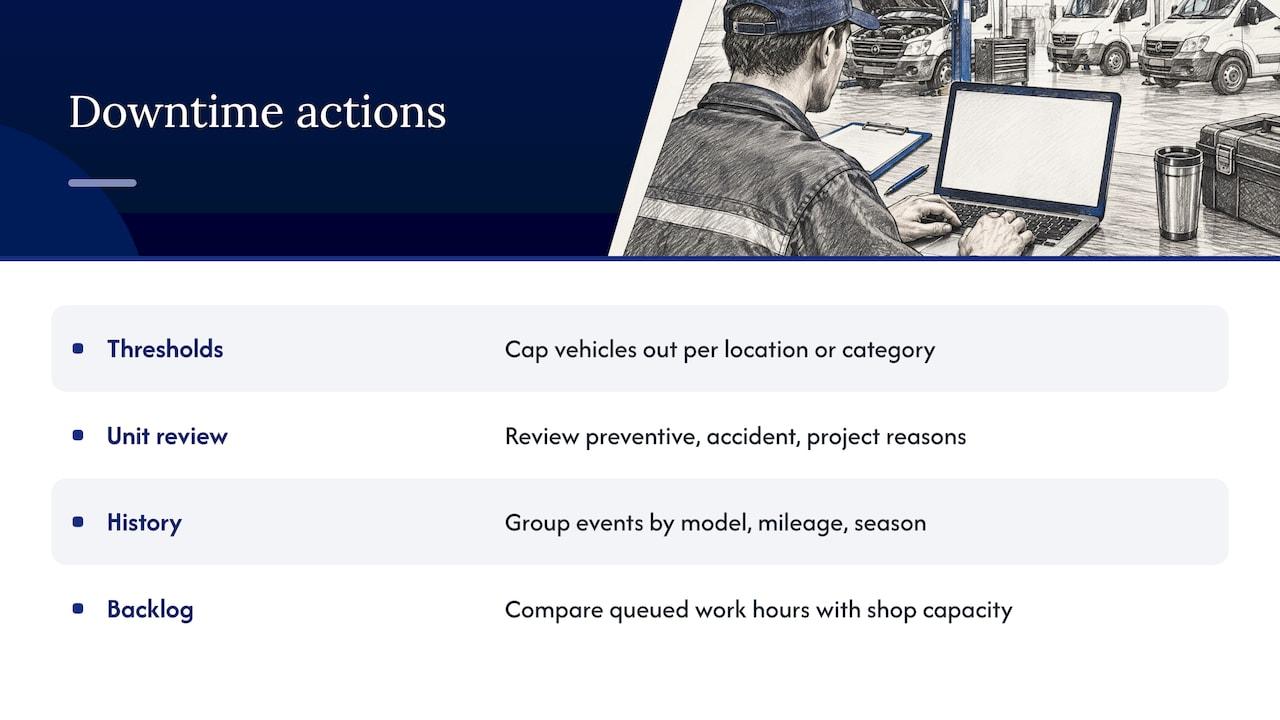
Set a threshold per location or category. The same FleetOwner article describes Estes Express setting a cap on how many vehicles can be out of service at each location, based on facility size and unit count. A small rental operation can do the same: for example, agree how many vehicles in each category can be down before you pause new reservations for that category or bring in outside help.
Ask which units should not be out. Once you have the reasons, look at each unit and ask whether it should have been down. Estes Express does this by examining whether the reason was preventive maintenance, an accident or a special project. In a rental fleet, a car in for an overdue oil service during a peak weekend is a scheduling problem, not a maintenance problem.
Use history to find patterns. Historical data shows when and why vehicles tend to break down, which can shape a more effective inspection program, as the same report notes. Group your downtime events by model, mileage band and season. If one model keeps returning with the same fault around a certain mileage, inspect it earlier.
The same report also notes that out-of-service data can show how many hours of work are queued and whether an outside vendor is needed to clear a backlog. For a growing rental fleet, that is a useful trigger: when the dashboard shows work hours outpacing shop capacity, decide before bookings are lost.
For more on this, read our guides on fleet maintenance management and uptime and on reducing idle days in rental fleets.
How often to review the dashboard
A dashboard nobody opens is decoration. One workable cadence, suggested by Rally, is to review operational exceptions daily, upcoming maintenance weekly, performance and cost monthly, and suppliers, utilization and replacement plans quarterly. It adds that the cadence should tighten whenever safety, compliance or vehicle availability is at risk.
Here is how that translates into a rental routine:
| Frequency | What to check | Who |
|---|
| Daily | Vehicles out of service, overdue return dates, tomorrow's reservations with no vehicle assigned, warning alerts | Operations lead |
| Weekly | Service due in the next 14 days, vehicles waiting on parts or approvals, bookings affected | Fleet manager |
| Monthly | Utilization by category, downtime days by reason, cost per vehicle | Owner or manager |
| Quarterly | Supplier performance, units to retire or add, seasonal capacity | Owner |
Pick a few alerts and keep them meaningful. Too many notifications get ignored. Good starting alerts are a vehicle out of service past its expected return date, a service coming due on a vehicle with an upcoming booking, and a vehicle offline from GPS during a rental.
Building your dashboard: spreadsheet or software
You can begin with a shared spreadsheet and a color-coded status column. It works for a handful of cars. It stops working when several people update it, when status depends on reservations, or when you need live location or alerts. At that point the manual copy between booking, maintenance and fleet records creates the errors a dashboard is supposed to prevent.
When you evaluate software, check that:
- Status is tied to reservations, so a vehicle change flags affected bookings.
- Downtime can be logged with reasons and timestamps.
- GPS tracking and payments connect to the same system.
- It works from any device, so the person at the counter and the person in the shop see the same thing.
- Setup will not stall your operation.
For more on the full workflow, our vehicle fleet management guide for car rentals and fleet management best practices cover it end to end.
Our perspective
Most rental owners we talk to do not lack data. They have it in a booking tool, a spreadsheet, a GPS portal and a notebook in the shop. What they lack is one place where those pieces agree with each other.
That is why we built Nomora around a single system for reservations, fleet management, contracts, payments and customer data. When a vehicle's status lives next to its bookings, the dashboard is not a separate project. It is simply what the operation looks like.
We believe the status view should be the first thing a manager opens in the morning. Real-time reservation and fleet tracking, integrated GPS and conflict-free booking are designed to help you see what is rentable, what is not and what is about to clash, before a customer is standing at the counter.
Our approach is also practical about time. Teams should be operational in 24 to 48 hours, because a tool that takes months to set up rarely gets used. Every plan includes all features, so a small operator gets the same visibility as a larger one.
Dizzy
See your fleet status in Nomora
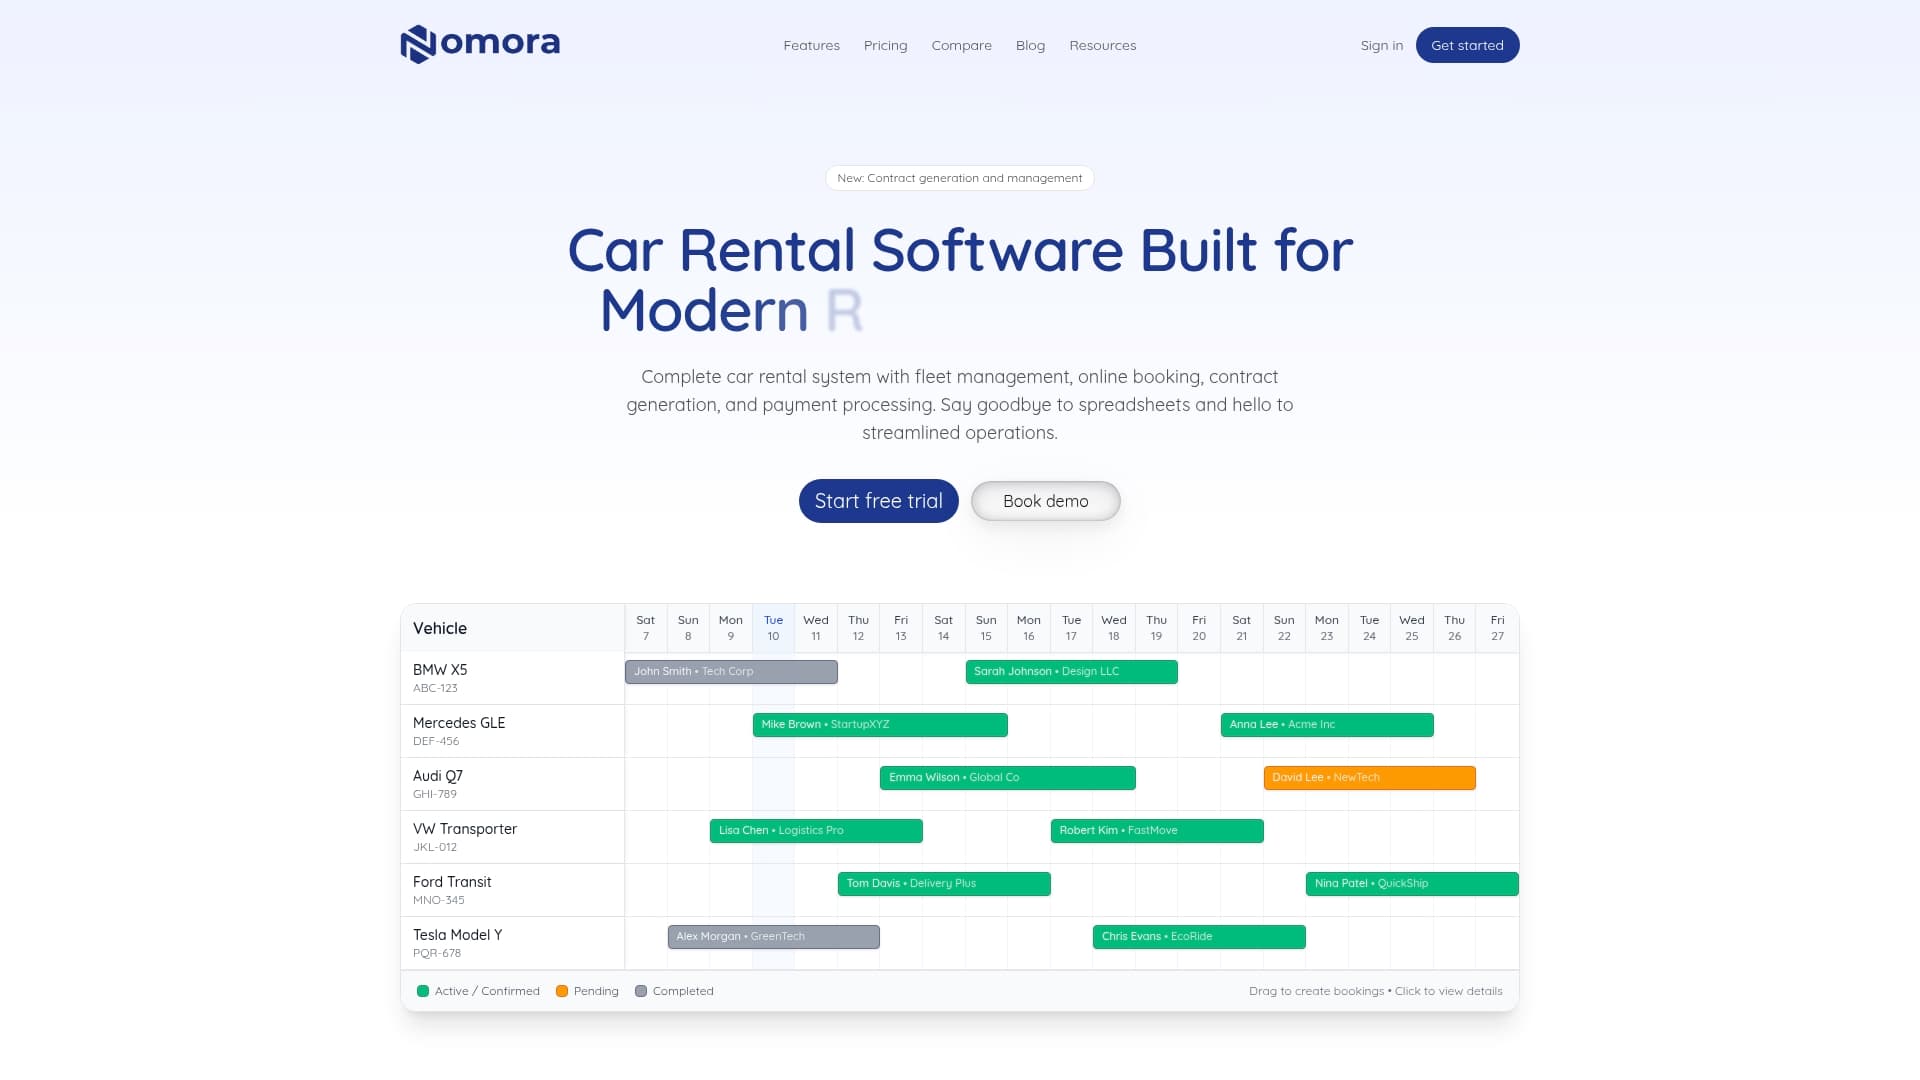
If you are running reservations and fleet records in separate places, Nomora is built to bring them together. It is a cloud-based car rental management platform that handles reservations, fleet management with GPS tracking, contract generation, payments and customer data, accessible from any device.
Pricing is published and every plan includes all features. The Starter plan is €45 per month, Business is €2.80 per vehicle per month, and Fleet is €2.20 per vehicle per month. Enterprise is available with pricing on request. Payment processing is a separate fee, listed on the pricing page. To see how it fits your business type, look at the use cases or explore Nomora's car rental software.
FAQ
What should a fleet status dashboard show?
At minimum, it should show each vehicle's current status (available, reserved, on rent, in maintenance, out of service), its expected return-to-service date and the reservations it affects. Add utilization, downtime, maintenance compliance and cost per vehicle as your core KPIs. Add GPS or diagnostic data if you collect it.
How do I calculate vehicle downtime for a rental fleet?
Log the time a vehicle leaves rentable inventory and the time it is cleared to rent again, with a reason code. Add up the days for each event across the period. Divide by total fleet days to get a downtime percentage, and group by reason to see what to fix first.
How often should I check my fleet dashboard?
Check exceptions such as out-of-service vehicles and unassigned bookings every day. Review upcoming maintenance weekly, and performance and cost monthly, following the cadence Rally outlines. Look more often whenever availability, safety or compliance is at risk.
Can a small rental company use a fleet dashboard?
Yes. The value does not depend on fleet size: even a few vehicles benefit from one view that links status to bookings. Nomora's Starter plan is €45 per month, and onboarding is designed to take 24 to 48 hours.
Sources
Recommended