Consolidated fleet reporting centralizes data from telematics, fuel, maintenance, and reservations to improve decision-making. It enhances real-time visibility, reduces administrative work, and drives more accurate metrics, resulting in lower costs and higher uptime. Starting with telematics and fuel data integration offers the fastest path to operational improvements in fleet management.
Consolidated fleet reporting is defined as the centralized aggregation and analysis of vehicle data from multiple sources, including telematics, fuel cards, maintenance platforms, and reservation systems, into a single unified reporting system. For vehicle rental operators, this approach replaces fragmented spreadsheets and disconnected software with one source of truth that drives faster, more accurate decisions. Platforms like Fleetio, Oxmaint, and Uptake have built their core value proposition around this concept. The industry term you will encounter most often is "unified fleet reporting" or "integrated fleet management reporting," and understanding what is consolidated fleet reporting is the first step toward running a data-driven rental operation.
What is consolidated fleet reporting and what data does it include?
Consolidated fleet reporting combines every major data stream from your fleet into one system, then surfaces that data as structured metrics and dashboards. The goal is not simply to collect more data. It is to eliminate the manual handoffs between systems that slow down decision-making and introduce errors.
The primary data inputs that feed a consolidated reporting platform include:
Telematics data: GPS location, mileage, engine diagnostics, idle time, and speed events from each vehicle
Fuel card transactions: Fuel spend per vehicle, fuel efficiency trends, and anomaly detection for potential misuse
Maintenance records: Scheduled service dates, repair histories, parts costs, and technician labor hours
Reservation and utilization data: Booking frequency, rental duration, and vehicle downtime between contracts
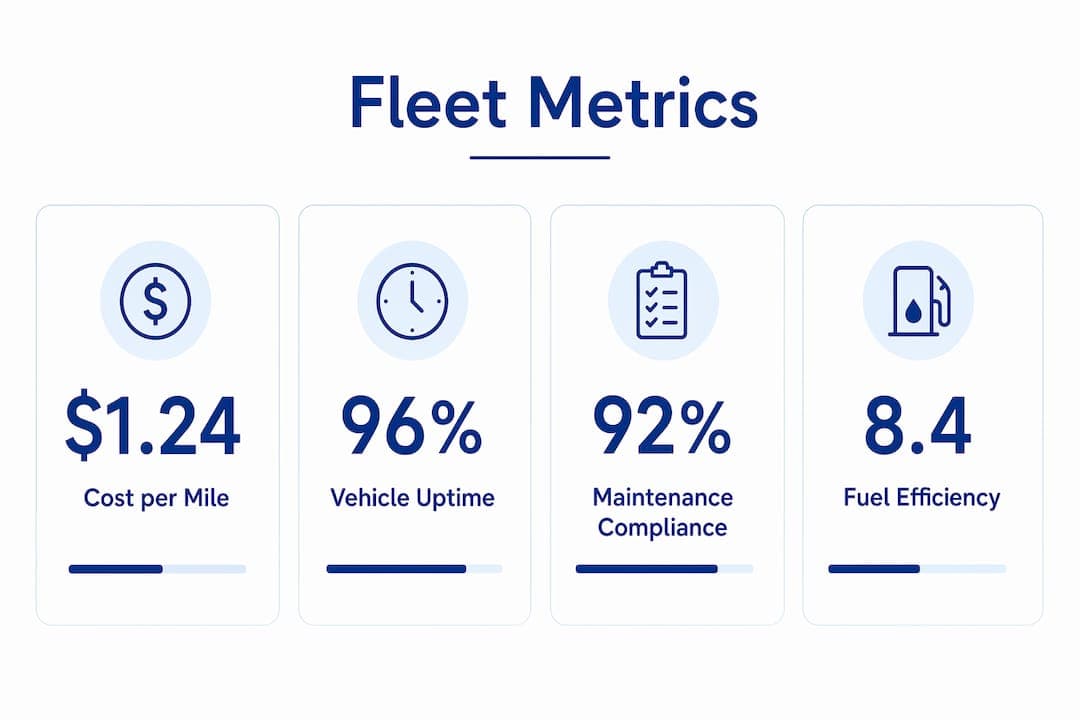
Once these inputs are unified, the platform generates the fleet performance metrics that matter most to rental operators. The table below outlines the most critical metrics and what each one reveals:
Metric
What it measures
Why it matters for rental fleets
Cost per mile
Total operating cost divided by miles driven
Identifies the most and least profitable vehicles in the fleet
Vehicle uptime
Percentage of time a vehicle is available for rental
Directly impacts revenue capacity
PM compliance rate
Percentage of preventive maintenance completed on schedule
Percentage of fleet actively rented vs. sitting idle
Guides decisions on fleet size and vehicle mix
These metrics only become reliable when the underlying data is clean and consistently updated. A utilization rate calculated from incomplete reservation data will mislead you just as badly as no data at all.
Why consolidated reporting outperforms fragmented fleet data systems
Traditional fleet reporting in rental businesses typically means pulling a fuel report from one portal, a maintenance log from another, and a utilization summary from a spreadsheet someone updated last Tuesday. The result is a picture of your fleet that is always slightly out of date and never fully accurate.
The operational cost of this fragmentation is measurable. Fleets tracking 15 or more performance metrics in a consolidated real-time dashboard achieve 24% lower cost-per-mile and 31% higher vehicle uptime compared to those relying on traditional reports. That gap represents real revenue and real savings for a rental business operating on thin margins.
The advantages of consolidated reporting over siloed systems come down to three structural improvements:
Real-time visibility: Alerts fire the moment a vehicle triggers a fault code or misses a scheduled service, rather than surfacing in a weekly report
Faster, more confident decisions: When cost, maintenance, and utilization data share the same timestamp and definitions, managers stop second-guessing which number to trust
"Consolidation is less about accumulating data and more about eliminating manual handoffs to enable real-time insights." — Neufutur Research, 2026
There is also a data integrity problem that fragmented systems make worse. Up to 90% of critical operational events remain undocumented digitally, meaning your KPIs often reflect paperwork rather than field reality. A vehicle that breaks down on a Saturday and gets a work order opened Monday shows a repair time of two days, not the actual four. Consolidated platforms that capture events in real time close this gap by starting the clock at the actual failure report, not the administrative response.
Pro Tip:Before evaluating any fleet reporting tool, audit how many of your current KPIs are calculated from data entered manually after the fact. If the answer is more than two or three, your baseline metrics are likely understating real costs and downtime.
How to consolidate fleet data from multiple sources
The practical challenge of consolidating fleet data is that each source speaks a different language. Your telematics provider exports in one format, your fuel card provider in another, and your maintenance software uses its own asset ID system that does not match either. Connecting these systems requires a deliberate integration strategy, not just a software subscription.
The most reliable approaches to data unification follow this sequence:
Use API integrations where available. Most modern telematics providers and fuel card platforms offer APIs that push data directly into a central system on a defined schedule. This eliminates file exports and the human error that comes with them.
Apply translation layers for legacy systems. Older maintenance software may not support API connections. In these cases, standardized CSV exports combined with field-mapping rules can normalize data before it enters the central platform.
Assign data ownership. Every data stream needs a named person responsible for its accuracy. Without accountability, fields go unmaintained and the consolidated report becomes unreliable within months.
Resist the urge to unify everything at once. Trying to connect every data point in the first phase creates complexity that stalls the project. Prioritize the streams with the highest impact on cost and uptime, then expand.
Combining fuel and maintenance cost data with asset records in one system is what makes precise cost-per-mile analysis possible. Without that combination, you are estimating, not measuring.
Pro Tip:Map your data sources on a whiteboard before touching any software. List each source, its update frequency, its unique vehicle identifier, and who owns it. This exercise alone will surface the conflicts that would otherwise derail your integration.
Best practices for applying fleet reports to rental operations
Consolidated vehicle tracking and reporting only creates value when the data drives decisions. Many rental operators invest in a unified platform and then continue managing the fleet the same way they always have, just with a better-looking dashboard. The operational discipline to act on the data is what separates high-performing fleets from average ones.
Here is how the best rental fleet managers translate consolidated reports into operational improvements:
Reduce idle time with utilization data. A consolidated utilization report shows exactly which vehicles sit between rentals longest. Use that data to rotate high-demand vehicles through service faster and retire or relocate underperforming assets. You can explore fleet utilization strategies in more depth to see how rental operators apply this in practice.
Schedule maintenance proactively.Standardizing input across financial and operational categories builds the trust in fleet data needed to justify proactive maintenance budgets. When your PM compliance rate is visible in real time, it becomes a managed metric rather than a lagging indicator.
Use cost-per-mile to guide replacement decisions. When a vehicle's cost-per-mile climbs consistently above fleet average for three consecutive months, that is a data-backed signal to retire it. Without consolidated reporting, that pattern is invisible until the vehicle becomes a crisis.
Set automated alerts for downtime triggers. Real-time alerts for fault codes, overdue service, or missed inspections let your team respond before a vehicle becomes unavailable for rental. This directly protects revenue.
Build executive-ready reports from standardized data.Normalized data from multiple suppliers creates a single source of truth that justifies budget requests and builds confidence with ownership or investors.
For rental businesses managing preventive maintenance compliance, the benchmark is clear: the industry average PM completion rate sits at 84%, while top-performing fleets reach 95 to 100%. Consolidated reporting is the mechanism that makes hitting the top tier achievable rather than aspirational.
Key takeaways
Consolidated fleet reporting works because it replaces disconnected data sources with a single, real-time system that makes cost, uptime, and utilization metrics accurate enough to act on.
Point
Details
Definition and purpose
Consolidated fleet reporting unifies telematics, fuel, and maintenance data into one platform for accurate decision-making.
Performance impact
Fleets using consolidated dashboards achieve 24% lower cost-per-mile and 31% higher vehicle uptime.
Integration priority
Connect telematics and fuel card data first to eliminate the largest sources of manual reconciliation.
Data integrity risk
Up to 90% of operational events go undocumented digitally, making real-time capture critical for accurate KPIs.
Operational application
Use consolidated reports to manage utilization, PM compliance, cost-per-mile trends, and executive budget justification.
The 42-Point Car Rental Operations Checklist
The exact checks profitable rental operators run every week — free, straight to your inbox.
Fleet readiness & handover
Bookings & no-show prevention
Pricing & revenue reviews
Contracts & compliance
Payments & invoicing
Maintenance & fleet health
One email with the checklist. No spam, unsubscribe anytime.
Where consolidated reporting is heading in rental fleets
The rental fleet operators I have seen get the most from consolidated reporting share one trait: they treat data quality as an operational discipline, not a technology problem. They assign ownership to every data stream, review metric definitions quarterly, and build dashboards that serve different roles rather than one generic view for everyone.
What concerns me about the current state of fleet analytics is the dark data problem. The finding that up to 90% of operational events remain undocumented digitally is not a technology failure. It is a process failure. No platform can consolidate data that was never captured. The next real advance in this space will come from agentic data capture systems that pull information from informal channels, voice notes, and field photos, and translate them into structured records automatically.
The other shift worth watching is role-specific dashboards. A fleet manager needs utilization and cost-per-mile. A maintenance coordinator needs PM compliance and MTTR. An owner needs revenue per vehicle and total fleet cost. Platforms that serve one generic dashboard to all three roles are already falling behind. The operators who will win in the next three years are building context-sensitive reporting layers on top of their consolidated data, not just consuming the default view.
My honest advice: do not wait for the perfect integration before acting on your data. Start with telematics and fuel cards, get those two streams clean and connected, and build from there. Imperfect consolidated data beats perfect fragmented data every time.
— Dizzy
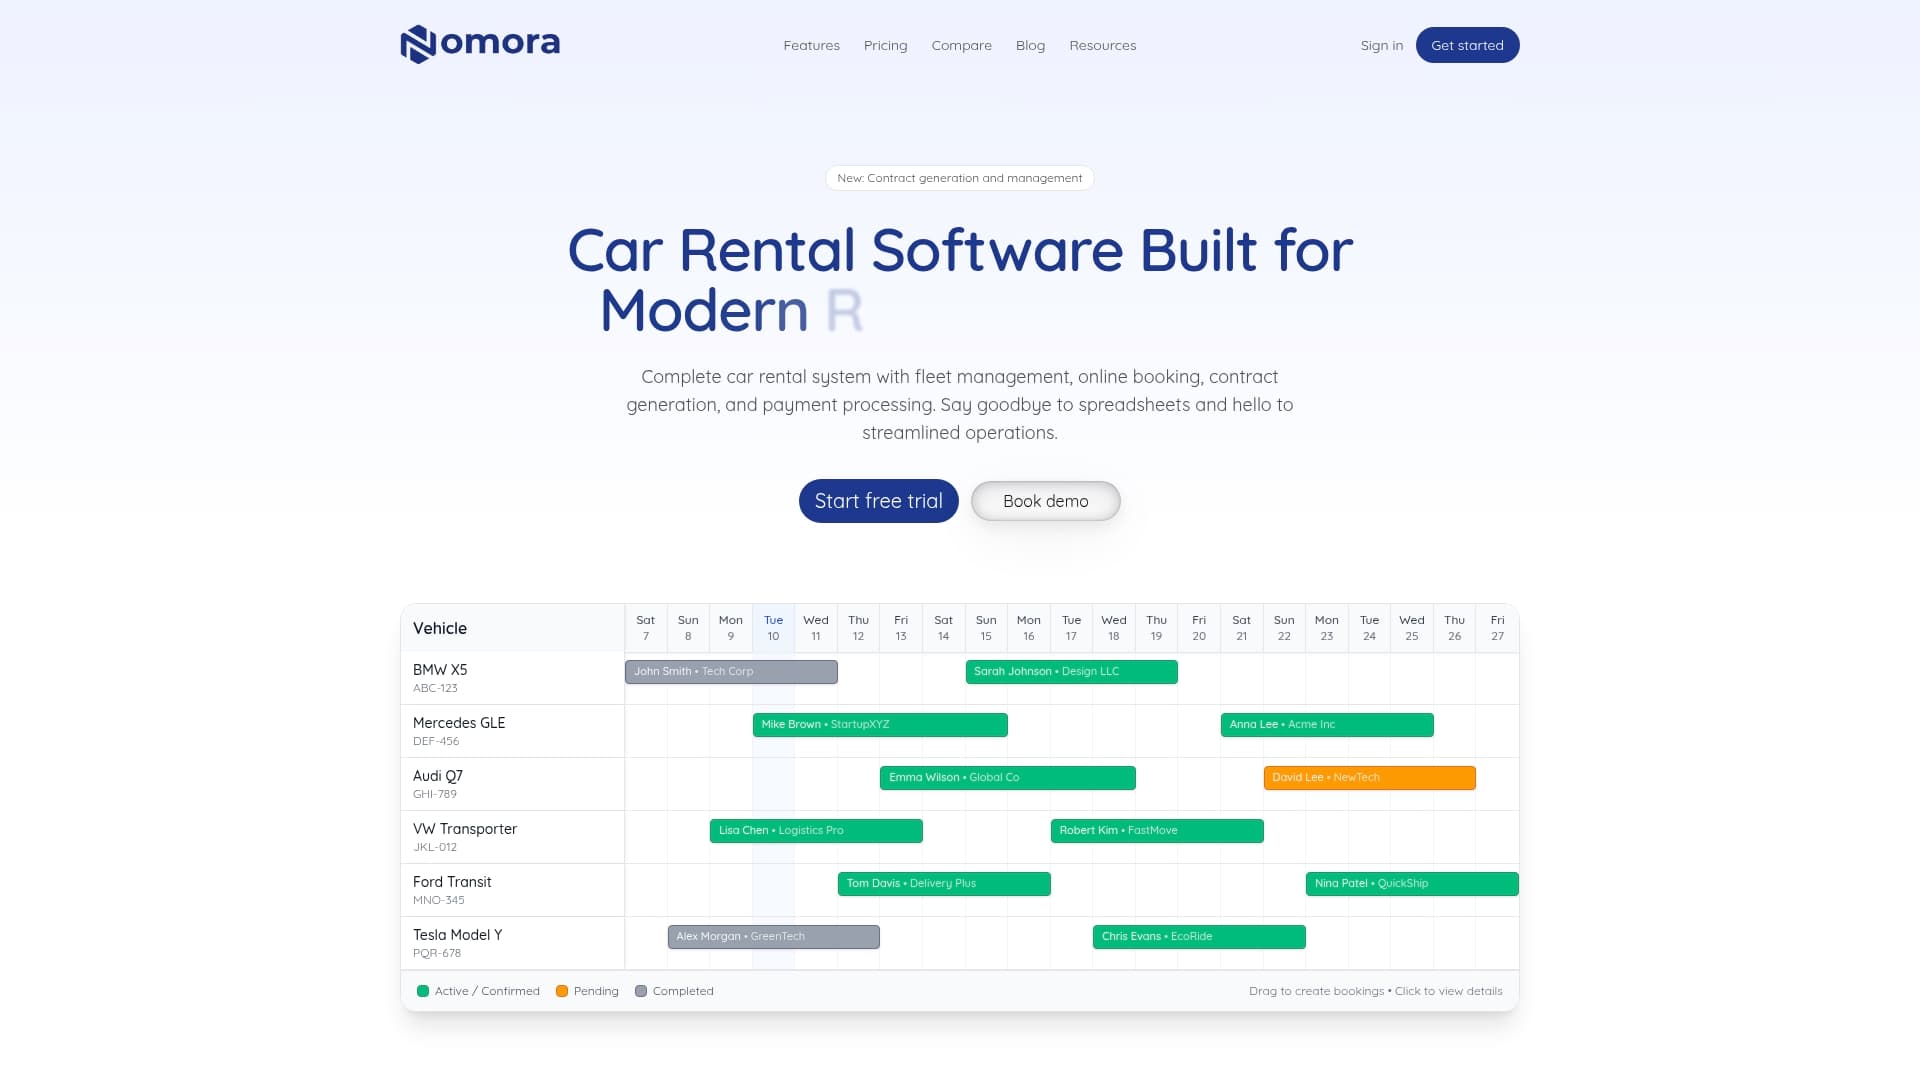
See how Nomora supports consolidated fleet reporting
Nomora functions as the central nervous system of a rental operation, connecting reservations, fleet management, payments, and customer data in one cloud-based platform. For rental businesses ready to move beyond spreadsheets, Nomora's car rental software solutions are built specifically for the operational realities of vehicle rental, from single-location independents to multi-site franchise networks.
Nomora integrates with GPS tracking providers and payment gateways to bring the data streams that matter most into one place, reducing the manual reconciliation work that erodes reporting accuracy. You can also explore how Nomora handles automated payment processing to see how financial transaction data feeds directly into your fleet cost reporting. Setup takes 24 to 48 hours, and the platform is GDPR-compliant with full cloud accessibility. If you are evaluating whether a unified platform fits your operation, the use cases page is the right place to start.
FAQ
What is consolidated fleet reporting in simple terms?
Consolidated fleet reporting is the practice of pulling data from telematics, fuel cards, maintenance systems, and reservation platforms into one unified dashboard so fleet managers can track performance, costs, and utilization without switching between tools.
What fleet performance metrics does consolidated reporting track?
The core metrics include cost per mile, vehicle uptime, preventive maintenance compliance, fuel efficiency, and utilization rate. Top-performing fleets track 15 or more of these metrics in real time to achieve measurably lower operating costs.
How long does it take to see results from consolidating fleet data?
Operational benefits, particularly reductions in administrative overhead, typically appear within the first 90 days of transitioning from manual or siloed reporting to a centralized dashboard, according to industry research.
What data sources should rental fleets connect first?
Telematics and fuel card data are the highest-priority integrations because they account for the majority of cost and performance data and eliminate the most manual reconciliation work when connected to a central platform.
Why is data accuracy a challenge in fleet management reporting?
Up to 90% of critical operational events go undocumented digitally, meaning KPIs often reflect administrative records rather than field reality. Real-time data capture and assigned data ownership are the two most effective ways to close this gap.