TL;DR:
- Business intelligence in rentals involves systematically analyzing operational and financial data to enable smarter decision-making across property management. Purpose-built rental BI platforms provide rapid, integrated insights that outperform generic tools, significantly reducing implementation time and manual workload. Implementing decision-led, clean data practices allows rental operators to achieve measurable gains in occupancy, retention, and cost savings while maintaining a competitive edge in the evolving market.
Business intelligence in rentals is defined as the systematic collection, integration, and analysis of operational and financial data to produce insights that drive smarter decisions across pricing, occupancy, maintenance, and tenant management. This is not a generic IT concept applied loosely to property. It is a specialized discipline where platforms like BubbleGum BI and Leasey.AI pull data directly from property management systems, run it through pre-built rental KPI dashboards, and surface the exact metrics that determine whether your portfolio performs or stagnates. For rental business owners managing fleets or properties in 2026, understanding what data analytics in rentals actually delivers is no longer optional. The operators who act on this knowledge are already pulling ahead.
What is business intelligence in rentals and how does it work?
Business intelligence for rental operations functions as the central nervous system of your management workflow. It connects every data source you already have, reservations, maintenance logs, payment records, customer history, and turns raw numbers into decisions you can act on today rather than next quarter.

Data analytics in rental management involves reviewing occupancy, booking pace, pricing, maintenance frequency, and costs to spot trends and improve decisions. That definition matters because it separates BI from simple reporting. A report tells you what happened. BI tells you why it happened and what to do next.
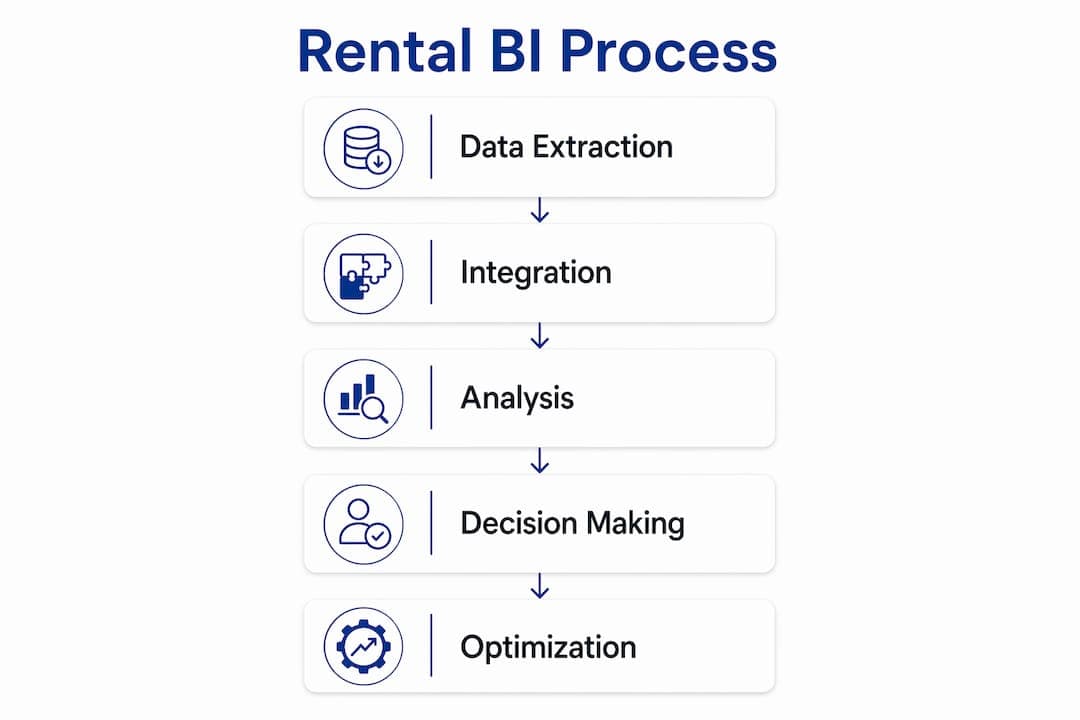
The process works in three stages. First, data is extracted automatically from your property management system or rental software. Second, it is normalized and stored in an integrated data warehouse. Third, pre-configured dashboards present the metrics that matter most to your specific operation, without requiring a data science team to build them from scratch.
What key data and metrics does business intelligence analyze in rental operations?
BI platforms in the rental sector track two distinct categories of metrics: operational and financial. Understanding the difference between them is what separates operators who use data reactively from those who use it to get ahead of problems.
Operational metrics include:
- Occupancy rate and booking pace by unit, vehicle, or property type
- Maintenance ticket volume, resolution time, and recurring issue patterns
- Tenant or customer behavior, including renewal likelihood and churn signals
- Booking lead time and seasonal demand shifts
Financial metrics include:
- Rent or rental revenue per asset and per portfolio segment
- Renovation ROI and capital expenditure performance
- Turnover costs, including cleaning, repairs, and vacancy loss
- Net operating income trends across time periods
The distinction between leading and lagging indicators is critical here. Lagging indicators like last month's revenue tell you what already happened. Leading indicators like current booking pace or maintenance ticket spikes tell you what is about to happen. Purpose-built BI platforms surface both, whereas manual spreadsheets almost exclusively show lagging data.
BI tools integrate directly with PMS systems like Yardi, Entrata, and AppFolio, automating data extraction and delivering pre-built industry dashboards within days or weeks. This direct integration eliminates the manual export cycle that consumes analyst time without producing insight.
Pro Tip: Before selecting a BI platform, map out the three decisions you make most often in your rental operation. Choose a tool that has pre-built dashboards for exactly those decisions. You will get value in days rather than months.
The gap between a purpose-built rental BI platform and a generic tool like Microsoft Power BI or Tableau is not a matter of features. It is a matter of time to value and operational fit.
| Factor | Generic BI tools | Purpose-built rental BI |
|---|
| Implementation time | 3 to 6 months of custom build | Hours to days with pre-configured dashboards |
| Dashboard setup | Built from scratch by analysts | Pre-built for rental KPIs out of the box |
| PMS integration | Requires custom API development | Direct connectors to Yardi, Entrata, AppFolio |
| Data warehouse | Must be architected separately | Integrated and managed by the platform |
| Rental-specific metrics | Not included by default | Occupancy, renewals, turnover costs included |
Generic BI tools require extensive custom dashboard building taking 3 to 6 months, whereas purpose-built rental BI platforms provide pre-configured dashboards delivering value in hours or days. For a rental operator managing 50 to 500 units or vehicles, that time difference is the difference between acting on this season's data and acting on last season's.
Manual spreadsheet workflows create a separate problem. Rental operators lose many hours weekly to manual spreadsheet exports and reconciliation, which BI platforms automate to free up analyst time for actual insight generation. That recovered time is not a soft benefit. It directly reduces labor cost and improves decision speed.
Short-term BI platforms can deliver value rapidly with pre-configured dashboards for occupancy, financials, renewals, and market intelligence targeting rental professionals. Platforms like BubbleGum BI and RentViewer are built specifically for this use case, which is why their deployment timelines and out-of-the-box relevance outperform generic alternatives for rental operators.
Pro Tip: If a vendor cannot show you a live demo of a rental-specific dashboard within 30 minutes of your first call, that is a signal their product was not built for your industry.
What measurable benefits can rental businesses achieve with BI?
The performance case for rental property management analytics is no longer theoretical. Purpose-built multifamily BI platforms deliver occupancy gains of 4.5%, retention improvements of 19%, renovation ROI of 25%, and turnover cost reductions of 19%. Across a portfolio of 200 units, a 4.5% occupancy gain and 19% reduction in turnover costs represent tens of thousands of dollars in annual recovered revenue.
"Rental markets' volatility and complexity make BI indispensable for proactive risk identification and strategic response rather than reactive problem solving." — Letting Agent Today
The benefits extend beyond occupancy numbers. Maintenance cost reduction is one of the most underappreciated outcomes. When BI surfaces patterns in maintenance ticket frequency by asset age or property type, operators can shift from reactive repairs to scheduled preventive maintenance. That shift reduces emergency repair costs and extends asset lifespan.
Tenant and customer satisfaction also improves when BI is in place. Operators who track renewal likelihood scores can intervene with targeted offers before a tenant decides to leave, rather than after they have already given notice. That proactive posture is only possible when you have the data infrastructure to see churn signals early.
The AI adoption picture adds urgency to this conversation. As of early 2026, 45% of rental operators understand AI's potential in BI, but only 28% have adopted it. That gap represents a competitive window. Operators who build their data infrastructure now will be positioned to layer AI-driven forecasting on top of clean, integrated data when they are ready. Those who wait will be starting from zero while competitors are already optimizing.
For car rental businesses specifically, the same principles apply to fleet utilization, booking conversion, and vehicle maintenance cycles. Nomora's approach to data-driven fleet management reflects how these analytics principles translate directly into vehicle rental profitability.
How can rental operators implement BI effectively?
Implementation success in rental BI comes down to four decisions made before you touch any software. Get these right and the platform delivers value quickly. Get them wrong and you end up with an expensive dashboard nobody checks.
-
Start with decisions, not data. Decision-led BI implementation requires starting with a specific business decision and working backward to identify the minimum required metrics. Ask yourself: what are the three decisions I make every week that I wish I had better data for? Build your BI setup around answering those questions first.
-
Clean your data before you analyze it. Integrating BI requires cleaning dirty data created by inconsistent entries in PMS systems. Enforcing standardized data entry is not a one-time task. It is an ongoing operational discipline. Assign one person ownership of data quality standards before you go live with any BI tool.
-
Choose integrated platforms over bolt-on tools. A platform with direct PMS connectors eliminates the manual reconciliation step entirely. Advanced reporting software for rental property management typically costs between $50 and $500 monthly per property, varying by portfolio size and features. That cost range is modest relative to the labor hours and decision errors it replaces.
-
Set a recurring review cadence. BI only delivers value if someone looks at it regularly and acts on what they see. Schedule a weekly 30-minute KPI review with your operations team. Track which metrics triggered decisions and which ones you ignored. Over time, you will refine your dashboard to show only what actually drives action.
Pro Tip: The biggest BI failure mode in rental businesses is building 40 charts and checking none of them. Start with five metrics, review them weekly, and add complexity only when you have outgrown the basics.
Understanding how car rental profitability connects to analytics infrastructure gives vehicle rental operators a concrete model for this implementation sequence.
Key takeaways
Business intelligence in rentals delivers measurable operational and financial gains only when built on clean data, decision-led design, and purpose-built tools rather than generic software or manual reporting.
| Point | Details |
|---|
| BI is a decision tool, not a report | Start with the decisions you need to make, then identify the minimum data required to support them. |
| Purpose-built tools outperform generic ones | Pre-configured rental dashboards deliver value in hours; generic tools take 3 to 6 months to configure. |
| Benchmarks are real and significant | Occupancy gains of 4.5% and retention improvements of 19% are documented outcomes from purpose-built BI platforms. |
| Data hygiene is non-negotiable | Dirty PMS data produces unreliable insights; standardized data entry must be enforced before analysis begins. |
| AI adoption gap is a competitive window | Only 28% of rental operators have adopted AI-driven BI, giving early movers a measurable advantage right now. |
Why I think most rental operators are using BI wrong
The most common mistake I see rental business owners make with BI is treating it as a reporting upgrade rather than a decision infrastructure. They buy a platform, connect it to their PMS, and then spend the first three months building dashboards that replicate the same reports they were already running in Excel. Nothing changes operationally. The tool gets blamed.
The operators who get real value from BI do something different from day one. They ask a specific question: "Why did our occupancy drop 6% in Q3 and what do we do about it?" Then they build the data infrastructure to answer that question and questions like it. That is decision-led analytics, and it produces outcomes that justify the investment.
The AI adoption gap I mentioned earlier is worth sitting with. The fact that 45% of operators recognize AI's potential but only 28% have acted on it tells you that awareness is not the bottleneck. Confidence and data readiness are. Most operators do not have clean, integrated data yet, which means they cannot layer AI on top of it even if they wanted to. The operators building that foundation now are not just preparing for AI. They are building the infrastructure that makes every operational decision faster and more accurate, regardless of what technology comes next.
Managing a rental portfolio without BI in 2026 is like running a fleet without GPS. You can do it, but you are making every routing decision blind while your competitors are watching real-time traffic.
— Dizzy
See how Nomora puts rental data to work
Nomora is built specifically for rental businesses that want real-time visibility into their operations without the complexity of generic BI tools. The platform consolidates reservations, fleet data, payments, and customer records into one system, giving you the data foundation that makes analytics actually useful.
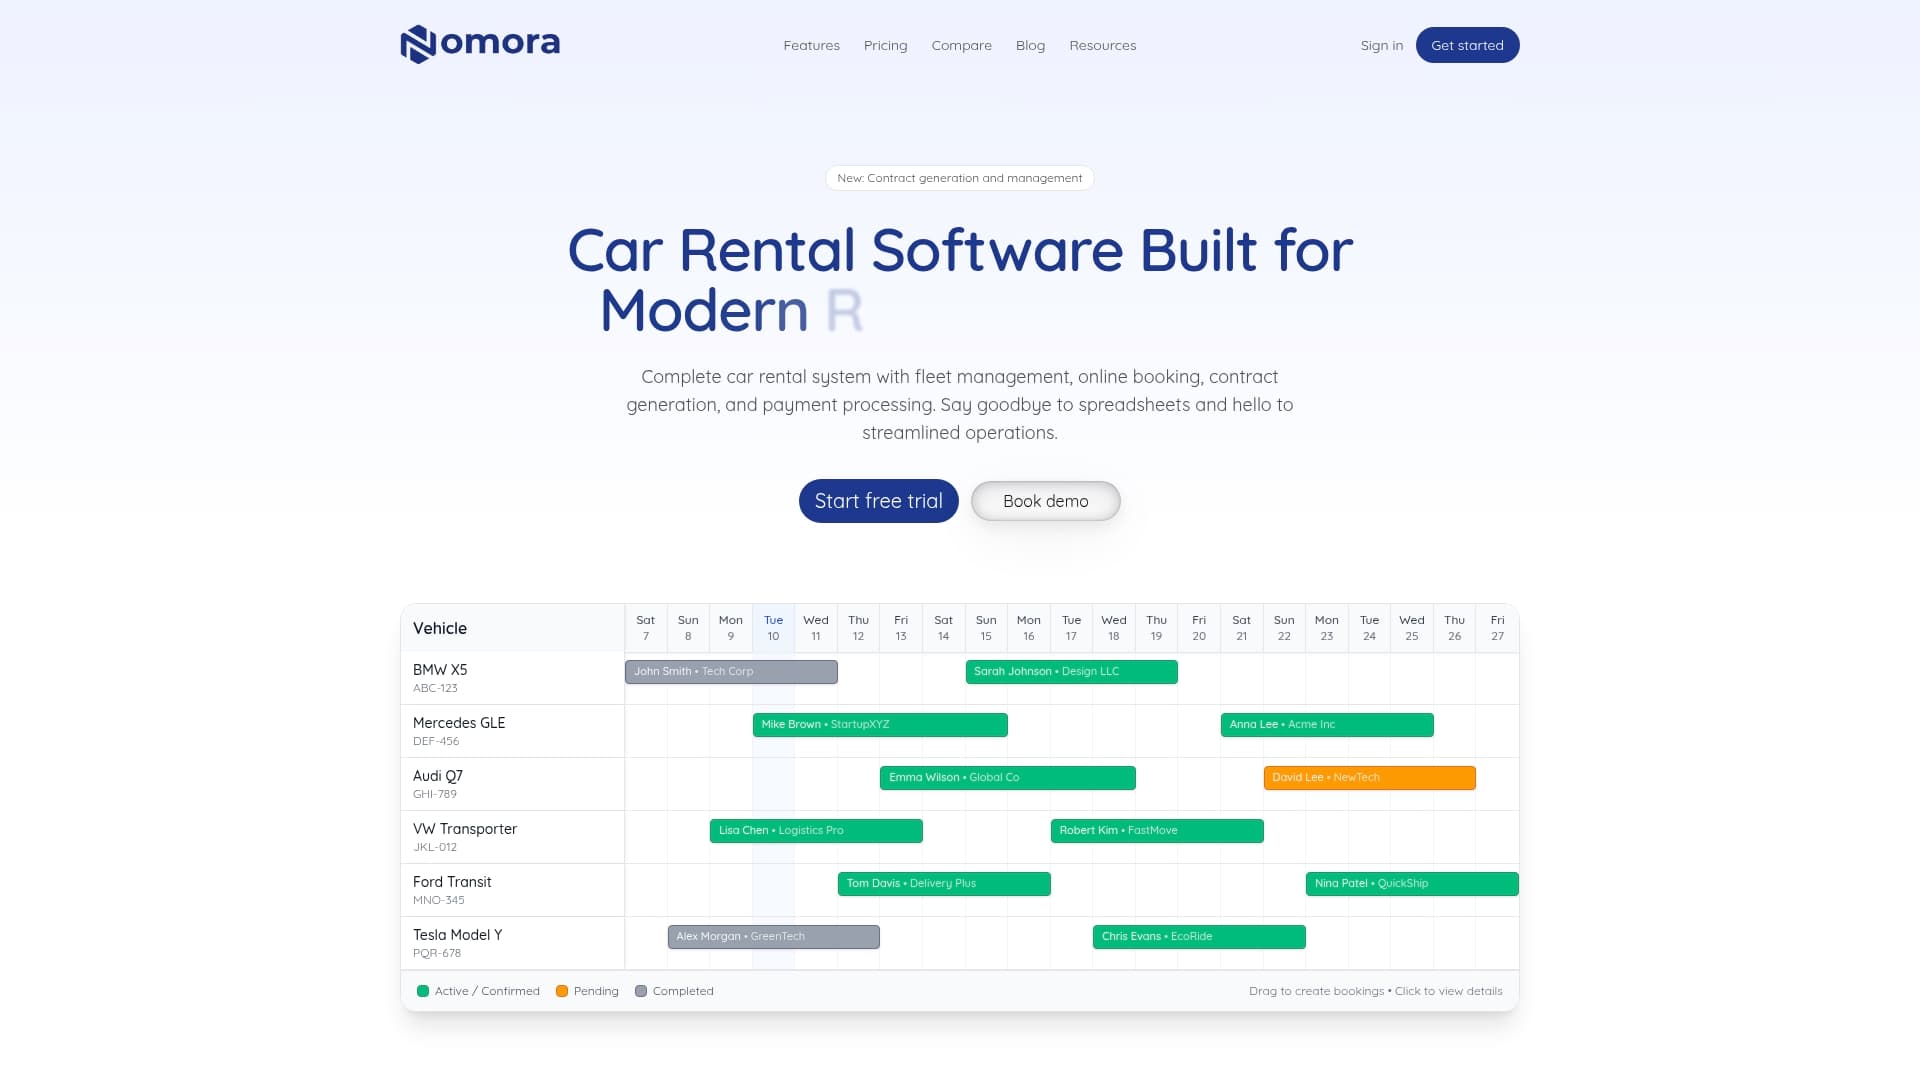
Whether you run a small independent fleet or a multi-location rental network, Nomora's automated reporting surfaces the metrics that matter without requiring a data team to build them. Explore Nomora's rental software use cases to see how operators across business types are using integrated data to make faster, more confident decisions every day.
FAQ
What is business intelligence in rentals?
Business intelligence in rentals is the process of collecting, integrating, and analyzing operational and financial rental data to produce insights that improve occupancy, pricing, maintenance, and retention decisions. It differs from standard reporting by connecting multiple data sources and surfacing leading indicators, not just historical results.
How does BI differ from standard rental reporting?
Standard reporting shows what happened in the past. BI combines historical data with real-time metrics and predictive signals to tell you what is likely to happen next and what action to take. Purpose-built platforms like BubbleGum BI and RentViewer deliver this through pre-configured dashboards connected directly to your PMS.
What results can rental businesses expect from BI?
Documented 2026 benchmarks show occupancy gains of 4.5%, tenant retention improvements of 19%, renovation ROI of 25%, and turnover cost reductions of 19% from purpose-built multifamily BI platforms. Results vary by portfolio size and data quality, but the directional gains are consistent across operators who implement BI with clean data.
Purpose-built rental BI platforms with direct PMS integrations typically deliver working dashboards within hours to a few days. Generic BI tools require 3 to 6 months of custom configuration before producing rental-relevant insights.
What does rental BI software cost?
Advanced reporting and BI software for rental property management typically costs between $50 and $500 monthly per property, depending on portfolio size and feature set. That range covers platforms from entry-level analytics tools to full-featured BI suites with AI-driven forecasting.
Recommended
Ready to streamline your car rental business?
Experience all the features mentioned in this guide with Nomora. Start your free 14-day trial today.